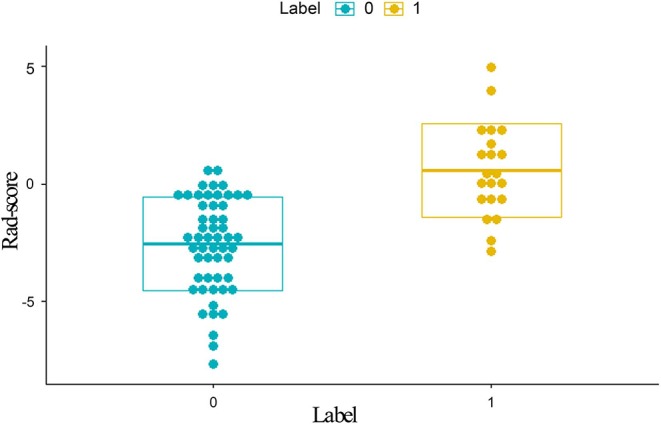
Figure 3.

Distribution of scores calculated with the radiomics model from DCE. Label 0 (green dots) represents EMVI-negative patients; Label 1 (yellow dots) represents EMVI-positive patients. EMVI-positive patients generally exhibited higher Rad-scores than EMVI-negative patients. DCE, dynamic contrast-enhanced; EMVI, extramural venous invasion; Rad-scores, radiomics scores.
