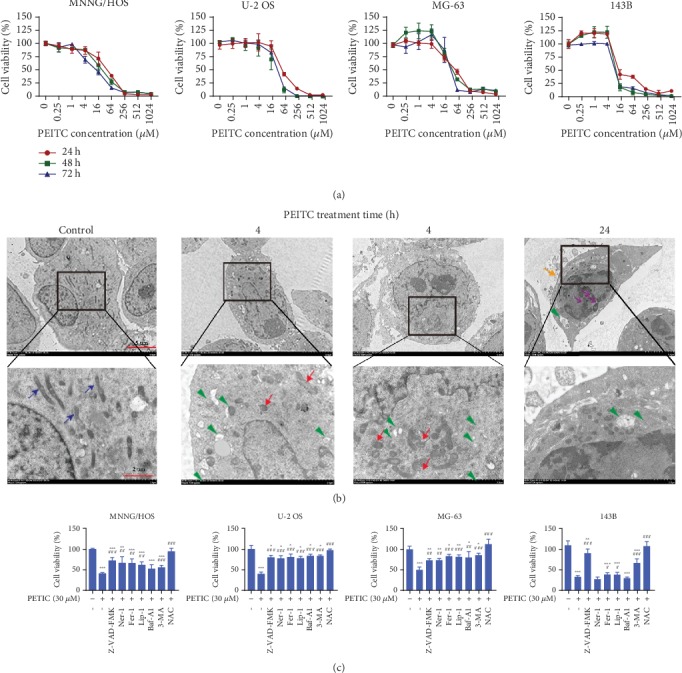
Figure 1.

PEITC reduced viability and induced cell death in human OS cells. (a) Viability of MNNG/HOS, U-2 OS, MG-63, and 143B cells treated with series concentrations of PEITC for 24 h, 48 h, and 72 h. The data were presented as mean ± SD (n = 4). (b) The subcellular structural changes in MNNG/HOS OS cells treated with 30 μM PEITC for 4 h, 12 h, and 24 h analyzed by TEM. Blue arrows indicated intact mitochondria. Green triangles indicate autophagic vacuoles containing intact and degraded cellular debris. Red arrows indicate round and shrunken mitochondria. Yellow arrows indicate a blebbed membrane. Purple arrows indicate nuclear fragmentation. (c) Viability of MNNG/HOS, U-2 OS, MG-63, and 143B cells treated with PEITC in the presence of 50 μM z-VAD-FMK, 50 μM Ner-1, 10 μM Fer-1, 100 nM Lip-1, 1 μM Baf-A1, 10 mM 3-MA, or 1 mM NAC for 24 h. The data were presented as mean ± SD (n = 4). ∗P < 0.05, ∗∗P < 0.01, and ∗∗∗P < 0.001 versus control group. #P < 0.05, ##P < 0.01, and ###P < 0.001 versus PEITC treatment group.
