
Figure 4.
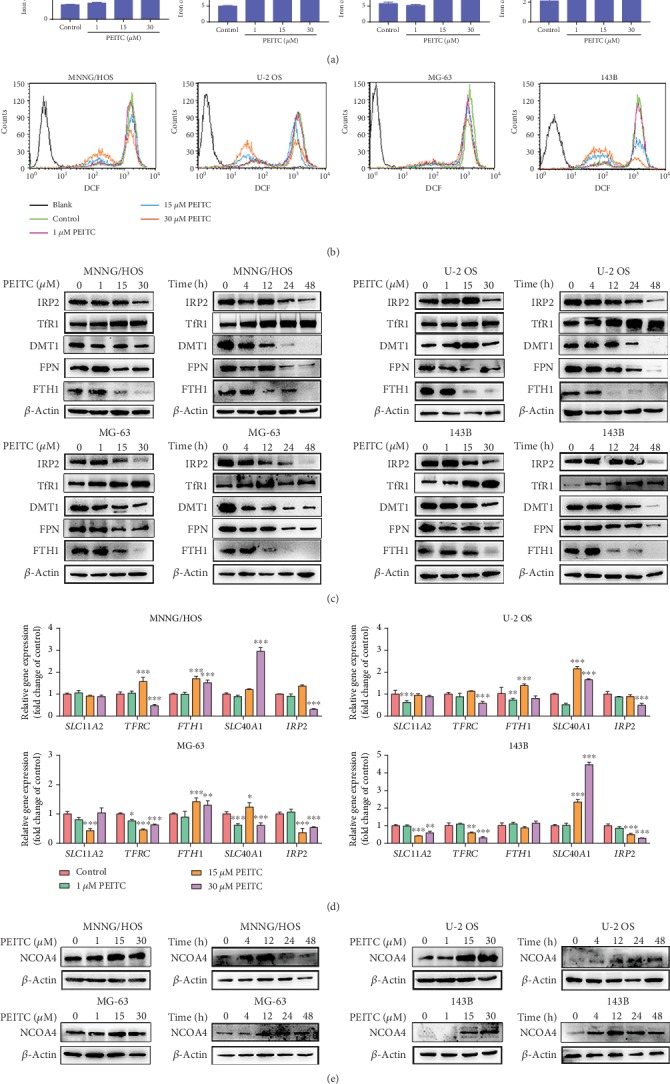
PEITC altered iron metabolism in human OS cells. (a) Total iron level in MNNG/HOS, U-2 OS, MG-63, and 143B cells after the indicated concentrations of PEITC treatment for 24 h by AAS. (b) The level of labile iron in MNNG/HOS, U-2 OS, MG-63, and 143B cells after the indicated concentrations of PEITC treatment for 24 h with Calcein-AM staining by flow cytometry analysis. (c) Protein expression levels of TfR1, DMT1, FTH1, FPN, and IRP2 in MNNG/HOS, U-2 OS, MG-63, and 143B cells treated with the indicated concentrations of PEITC for 20 h or 30 μM PEITC for 4 h, 12 h, 24 h, and 48 h. (d) mRNA levels of TFRC, SLC11A2, FTH1, SLC40A1, and IRP2 in MNNG/HOS, U-2 OS, MG-63, and 143B cells after PEITC treatment for 24 h. (e) Protein expression levels of NCOA4 in MNNG/HOS, U-2 OS, MG-63, and 143B cells treated with the indicated concentrations of PEITC for 20 h or 30 μM PEITC for 4 h, 12 h, 24 h, and 48 h. All data were presented as the means ± SD (n = 3). ∗P < 0.05, ∗∗P < 0.01, and ∗∗∗P < 0.001 versus control group.