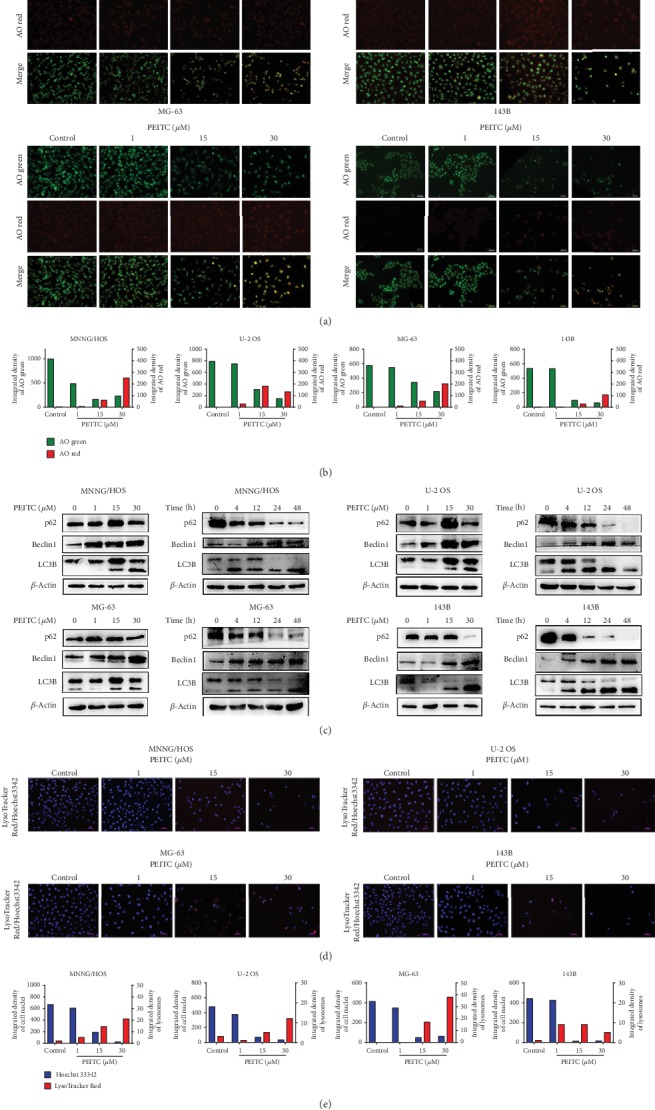
Figure 7.

PEITC induced autophagy in human OS cells. (a) Acidic vacuole organelles in MNNG/HOS, U-2 OS, MG-63, and 143B cells treated with the indicated concentrations of PEITC for 24 h by AO staining. (b) Quantitative analysis of AO red fluorescence and AO green fluorescence in (a). (c) Protein expression levels of Beclin1, LC3B, and p62 in MNNG/HOS, U-2 OS, MG-63, and 143B cells treated with the indicated concentrations of PEITC for 20 h or 30 μM PEITC for 4 h, 12 h, 24 h, and 48 h. (d) Lysosomes in MNNG/HOS, U-2 OS, MG-63, and 143B cells treated with the indicated concentrations of PEITC for 24 h by using a LysoTracker Red sensor. (e) Quantitative analysis of lysosomes in (d).
