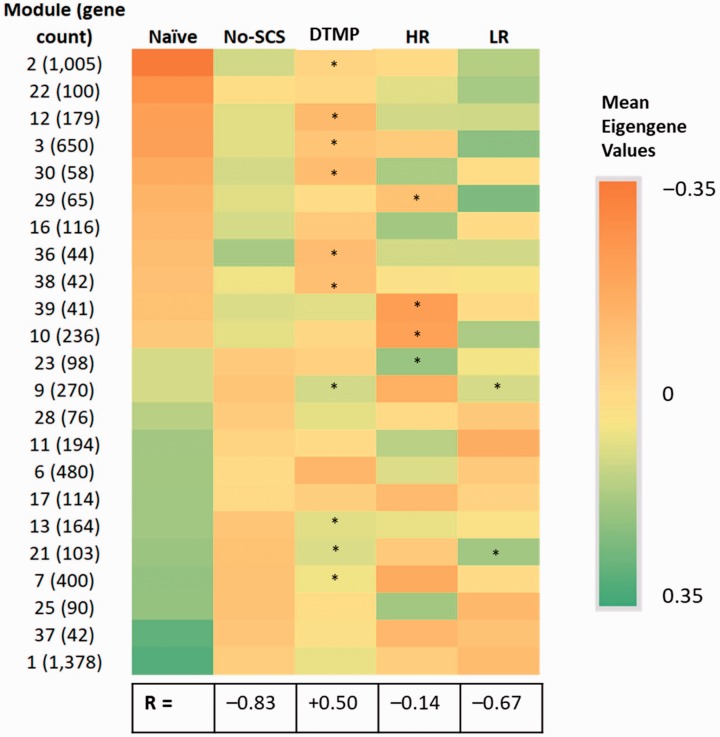
Figure 4.
Heat map of mean module eigengene values for modules with significantly different comparisons (FDR-p < 0.2) between injured untreated animals (No-SCS) and Naïve animals. A total of 23 modules out of the total 39 are affected. Asterisks (*) indicate significantly different module eigengene values when comparing either SCS treatment to untreated animals (No-SCS). R is the Pearson coefficient for the correlation between eigengene values for naïve and each of the other groups. A negative value indicates an opposite trend. DTMP: differential target multiplexed programming; LR: low rate; HR: high rate; SCS: spinal cord stimulation.

