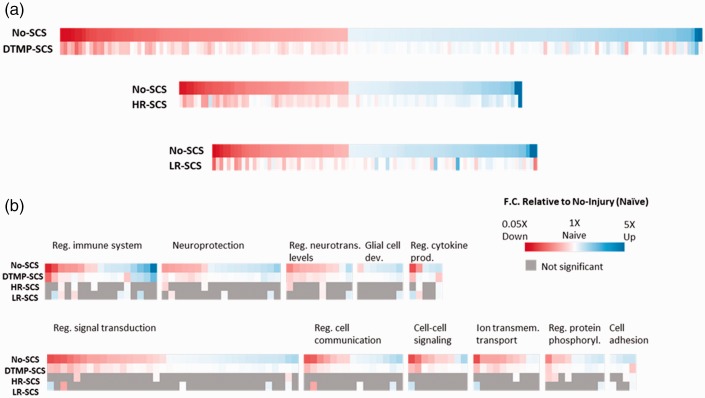
Figure 6.
(a) Heat maps illustrating the most significantly changed gene expressions due to injury (No-SCS) and the effect of treatments (DTMP, HR, or LR) relative to expression in naïve animals. Each colored column is a gene. Note that DTMP modulates a larger number of genes towards the naïve state (represented by white columns) than HR and LR. (b) Heat map of genes regrouped in terms of involvement in relevant biological processes. Gray boxes indicate that therapy did not produce a significant change. The intensity of red color is proportional to the extent to down regulation relative to expression in naïve; the intensity of blue color is proportional to the extent of upregulation relative to expression in naïve. White indicates that therapy modulated expression back to levels of naïve animals. DTMP: differential target multiplexed programming; LR: low rate; HR: high rate; SCS: spinal cord stimulation.

