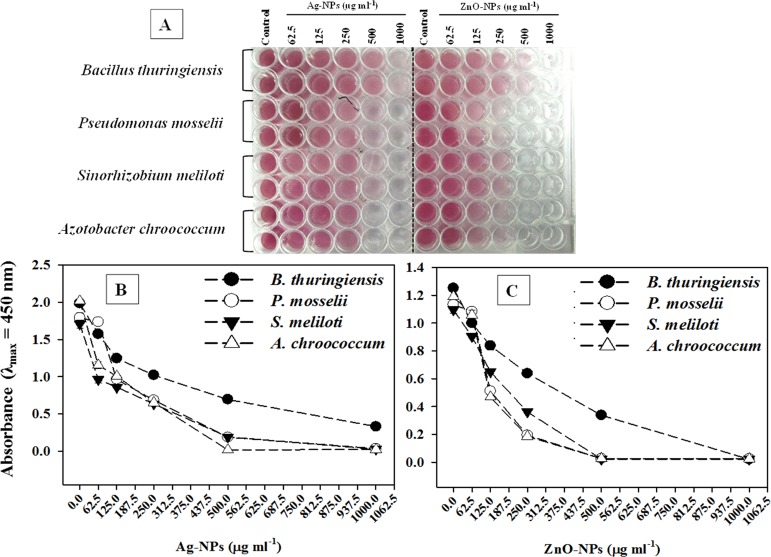
Figure 2.
Inhibition of cellular respiration of B. thuringiensis, P. mosselii, S. meliloti, and A. chroococcum exposed to 62.5–1000 μg mL–1 each of Ag-NPs and ZnO-NPs. (A) Decrease in red color intensity in microtiter wells represents the loss of metabolic activity of bacterial cells. (B, C) Spectrophotometric measurement of red colored formazan.

