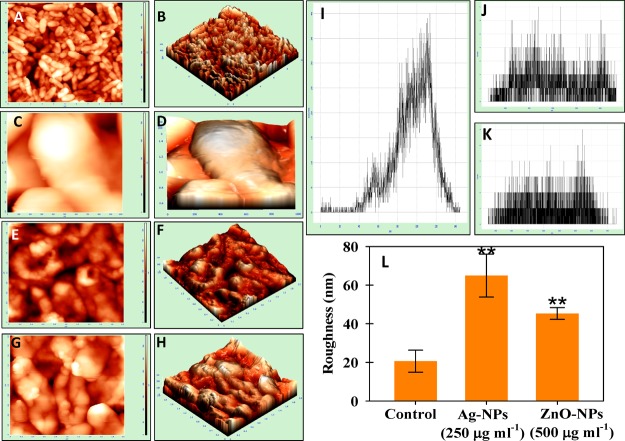
Figure 5.
NPs induced morphological damage to the surface of S. meliloti measured by (A, C, E, G) two- and (B, D, F, H) three-dimensional AFM. (A–D) Control cells treated with (E, F) 500 μgAg-NPs mL–1 and (G, H) 500 μgZnO-NPs mL–1. (I–K) Representative histograms of the roughness of (I) control, (J) Ag-NP treatment, and (K) ZnO-NP treatment. (L) Statistical analysis of roughness (nm). The roughness was calculated from 10 cells for each treatment. Asterisks indicate significant difference at P < 0.001.

