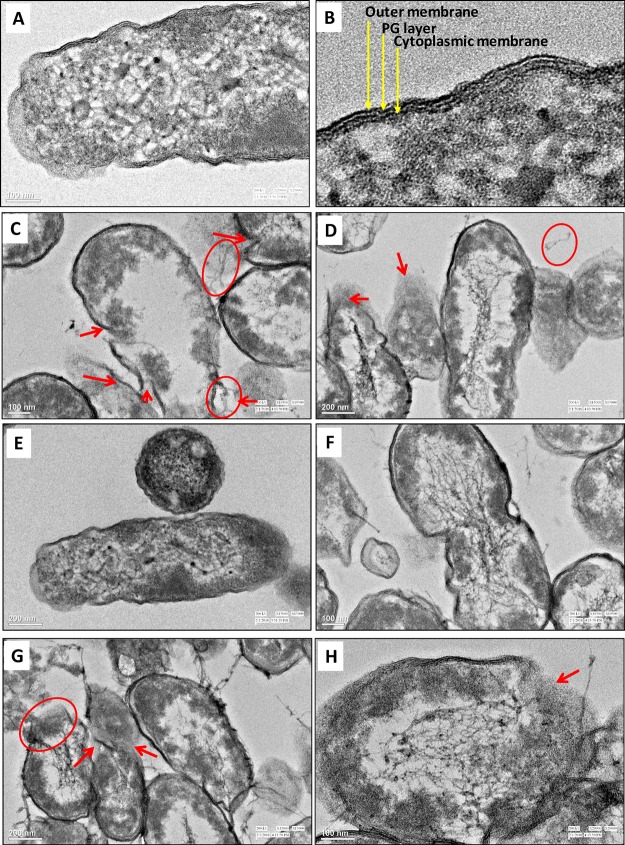
Figure 7.
NP–bacteria interaction. HR-TEM images of untreated cells of (A) P. mosselii, (B) a magnified view of cell envelope, and after interaction with 500 μg mL–1 each of (C) Ag-NPs and (D) ZnO-NPs, (E) untreated cells of A. chroococcum, (F) a magnified view of the cell envelope, and after interaction with 500 μg mL–1 each of (G) Ag-NPs and (H) ZnO-NPs. Red circles show leakage of the cellular content, while arrows indicate cellular damage.

