Figure 6.
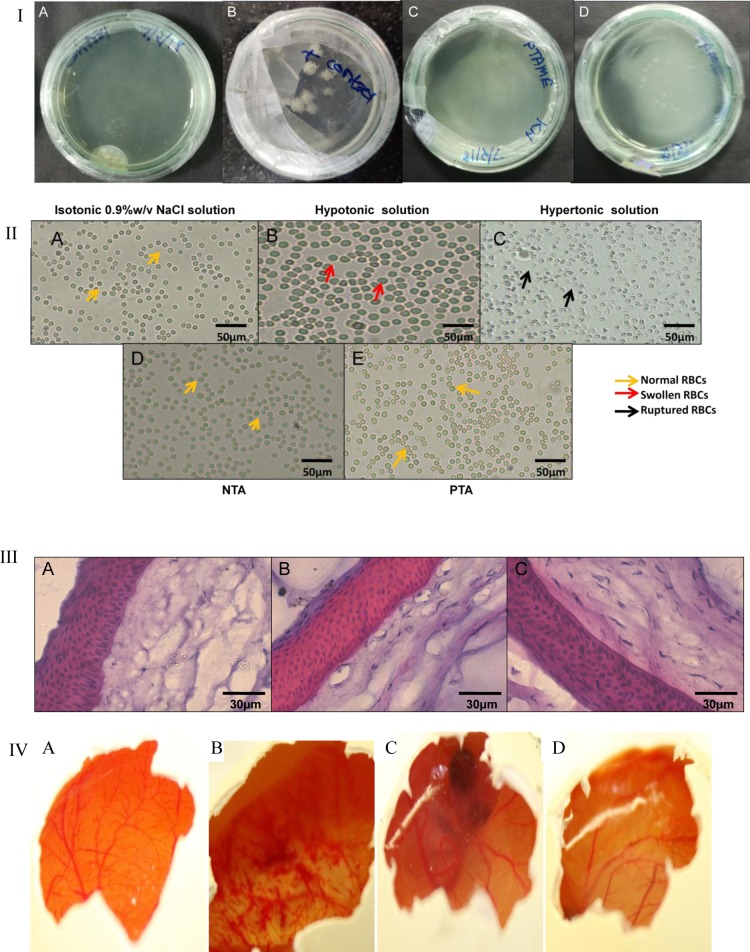
(I) Sterility test; images of culture plates in incubation with (A) saline solution, (B) positive control, (C) PTA and (D) NTA. (II) Isotonicity test with RBCs treated with (A) saline solution, (B) hypotonic solution, (C) hypertonic solution, (D) NTA, and (E) PTA observed under a microscope, (III) H and E staining on corneal sections treated with (A) saline solution, (B) NTA and (C) PTA; observed under a microscope. (IV) Images after 3 h of HET-CAM test on hen’s eggs treated with (A) saline solution, (B) NaOH solution, (C) NTA, and (D) PTA.

