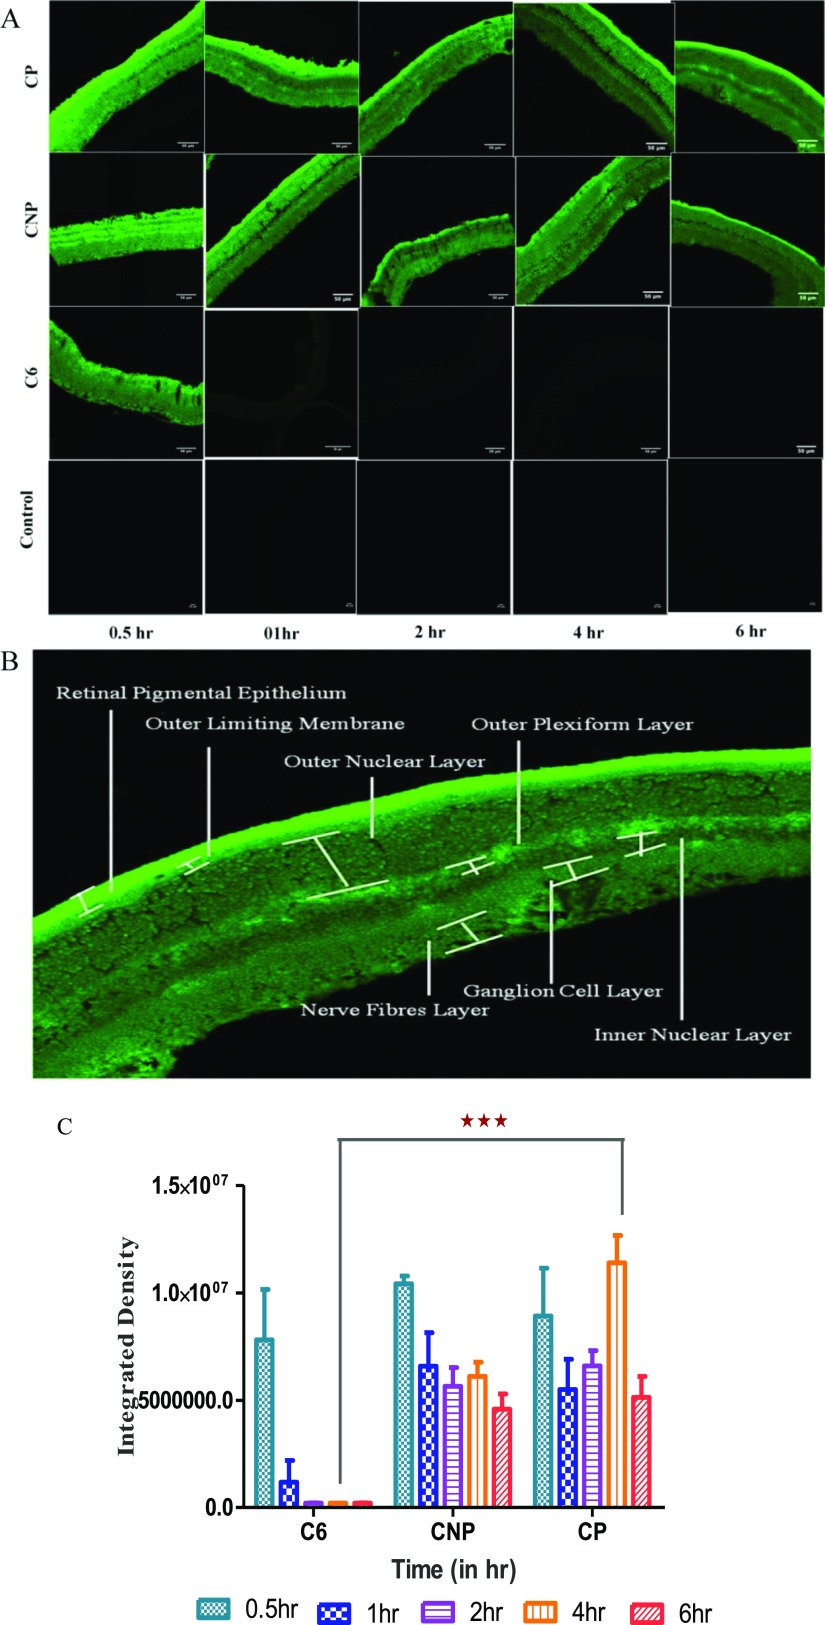
Figure 8.
In vivo pharmacokinetic study on Sprague Dawley rats. (A) Images (scale bar 50 μm) of retina of rat eye by a CLSM after definite time duration of topical instillation of 5 μL of C6 solution, CNP, CP as compared to control eye (untreated contralateral eye) (in images of C6, CNP, and CP groups, zoom factor 3 was applied to make retinal layers more distinguishable while same was not applied in control group) (B) representative image of retina observed under a CLSM showing different layers and (C) graph showing comparison of raw integration density observed after instillation of different formulation (CNP and CP) and C6 solution at definite time points. Values were obtained using ImageJ software and were in mean ± SD, n = 3. ***Indicates the significant difference in fluorescence observed at 4 h of instillation of topical dosage of CP as compared to other groups (P < 0.001).

