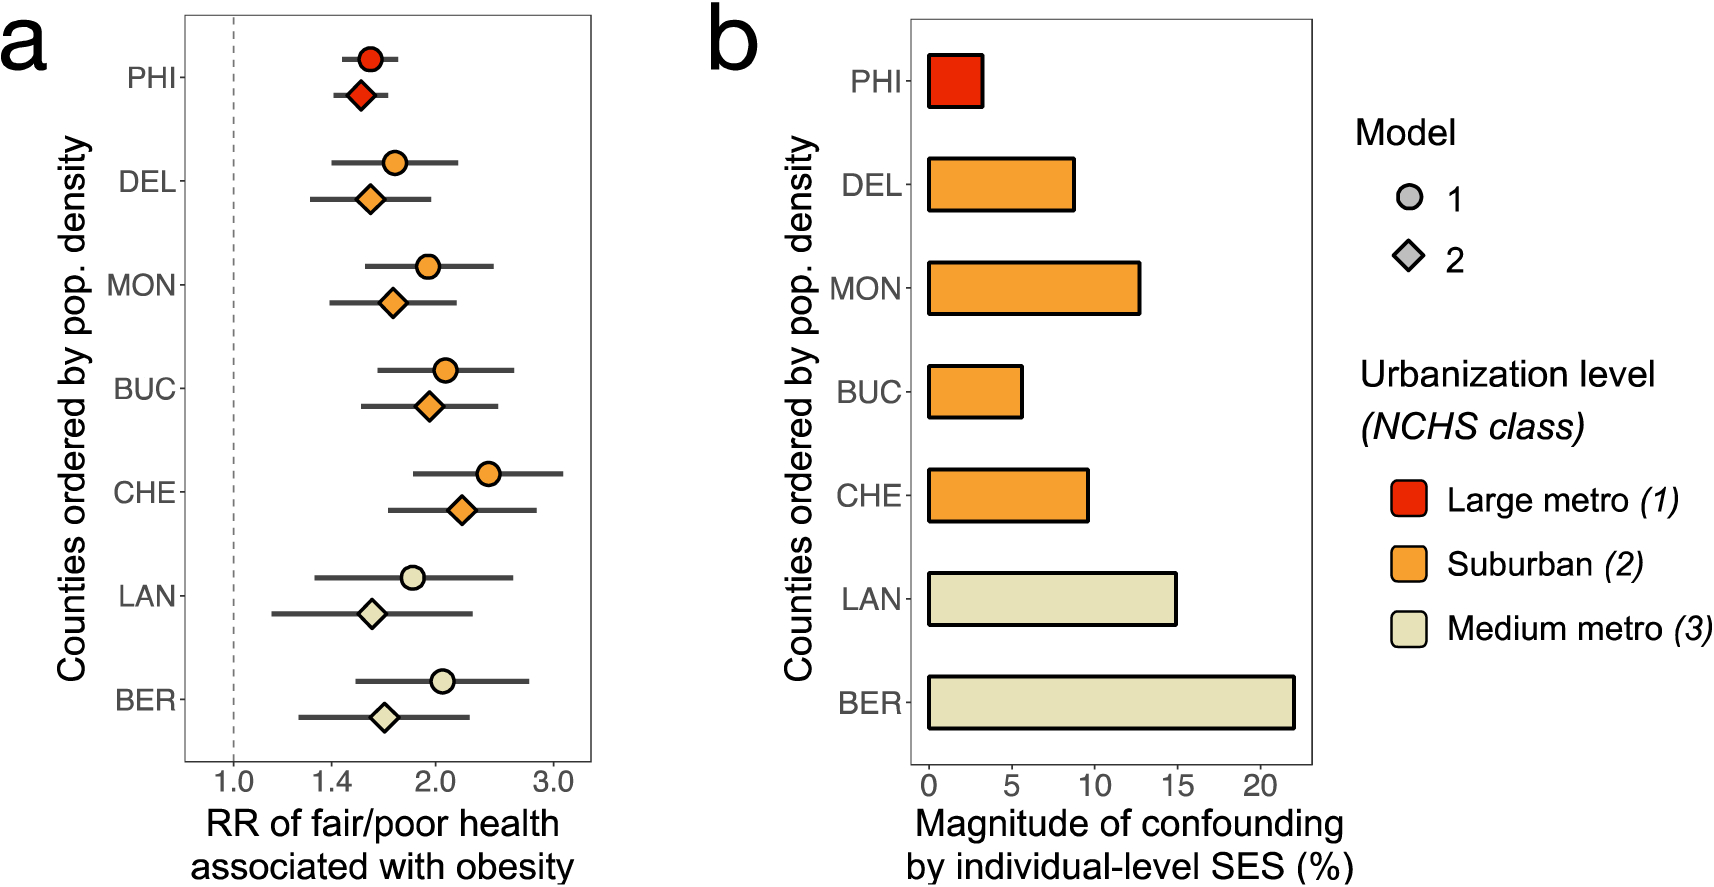
Fig. 3.

Estimated magnitude of residual confounding by individual-level SES when only neighborhood-level SES was accounted for. Fig. 3a shows the relative risk (RR) of self-rated fair/poor health associated with obesity according to multivariable Poisson regression estimated using model 1, which included demographic variables and neighborhood advantage and model 2, which included demographic variables, neighborhood advantage, relative household income and respondent education. Fig. 3b shows the magnitude of confounding by individual-level SES estimated as 100*(RR1 − RR2)/RR2, where RR1 and RR2 were estimated using models 1 and 2, respectively. PHI = Philadelphia, BUC = Bucks, CHE = Chester, DEL = Delaware, MON = Montgomery, BER = Berks, LAN = Lancaster, and SCH = Schuylkill.
