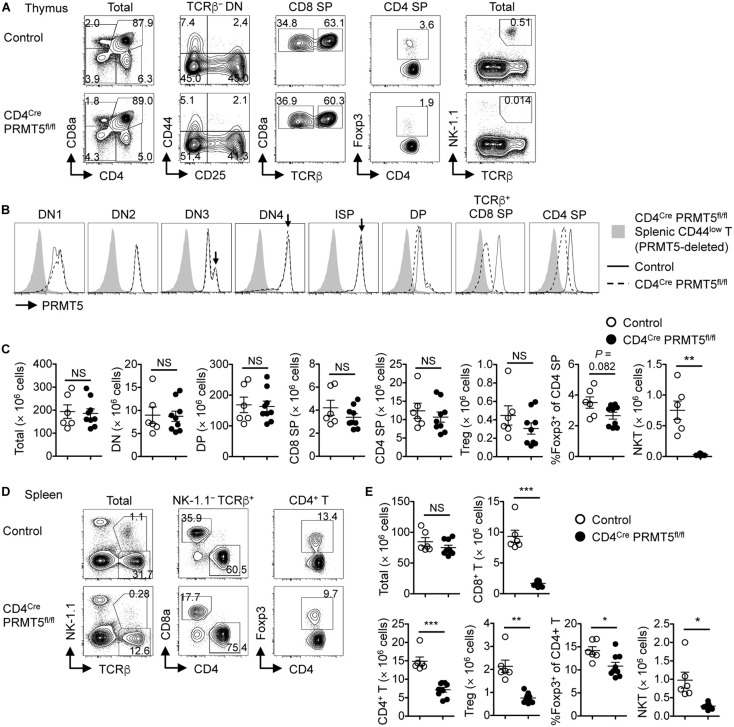
FIGURE 1.
T-cell-specific deletion of PRMT5 leads to peripheral T cell lymphopenia in mice. (A–C) Thymocytes from control and CD4Cre PRMT5fl/fl mice were analyzed by flow cytometry. (A) Thymocytes were classified into DN (CD8a– CD4–), DP (CD8a+ CD4+), CD8 SP (CD8a+ CD4–), and CD4 SP (CD8a– CD4+) cells. TCRβ– DN cells were further divided into DN1 (CD44+ CD25–), DN2 (CD44+ CD25+), DN3 (CD44– CD25+), and DN4 (CD44– CD25–) cells. CD8 SP cells include TCRβ– ISP cells. CD4 SP cells include Foxp3+ Treg cells. NKT cells were defined as NK1.1+ TCRβ+ cells. (B) Representative histograms show PRMT5 expression by thymocytes from three independent experiments. Peripheral CD44low T cells from CD4Cre PRMT5fl/fl mice were used as a negative control for PRMT5 staining. (C) The absolute numbers of thymocytes in control mice (n = 6) and CD4Cre PRMT5fl/fl mice (n = 9) from three independent experiments are plotted as mean ± SEM. (D,E) Splenocytes from control and CD4Cre PRMT5fl/fl mice were analyzed by flow cytometry. (D) Representative plots show CD8+ T (NK-1.1– TCRβ+ CD8a+), CD4+ T (NK-1.1– TCRβ+ CD4+), Treg (NK-1.1– TCRβ+ CD4+ Foxp3+), and NKT (NK-1.1+ TCRβ+) cells. (E) The absolute numbers of splenic T cell subsets in control mice (n = 6) and CD4Cre PRMT5fl/fl mice (n = 9) from three independent experiments are plotted as mean ± SEM. *P < 0.05, **P < 0.01, ***P < 0.001, by unpaired two-tailed Student’s t-test. NS, not significant.

