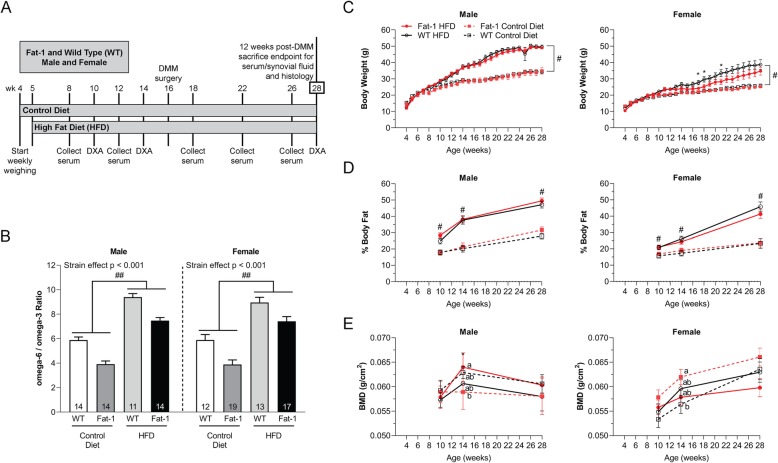
Fig. 1.
a The experimental design. Control and HFD treatment started at 5 weeks of age for both WT and fat-1 mice. DMM was performed at 16 weeks of age, and animals were sacrificed 12 weeks post-DMM surgery to evaluate OA and joint synovitis. b Serum ω-6/ω-3 FA ratio. Two-way ANOVA within the same sex. p < 0.001, WT vs. fat-1 strain effect. ##p < 0.001, HFD vs. control diet. The number (n) of the mice used in each group is indicated on plots. Data presented as mean ± SEM. c Body weight and d percent body fat over time. Two-way repeated measures ANOVA followed by Fisher’s LSD post hoc. #p < 0.05, HFD vs. control diet. *p < 0.05, WT female mice treated with HFD vs. fat-1 female mice treated with HFD. Data presented as mean ± SEM. e Whole-body BMD. Two-way repeated measures ANOVA followed by Fisher’s LSD post hoc. Groups not sharing the same letter are significantly different, p < 0.05, at 14 weeks of age. Data presented as mean ± SEM. For BMD and percent fat: male control diet WT n = 16, fat-1 n = 13; male HFD WT n = 12, fat-1 n = 15; female control diet WT n = 12, fat-1 n = 17; and female HFD WT n = 13, fat-1 n = 16. For body weight: male control diet WT n = 16, fat-1 n = 8; male HFD WT n = 7, fat-1 n = 15; female control diet WT n = 12, fat-1 n = 17; and female HFD WT n = 8, fat-1 n = 11

