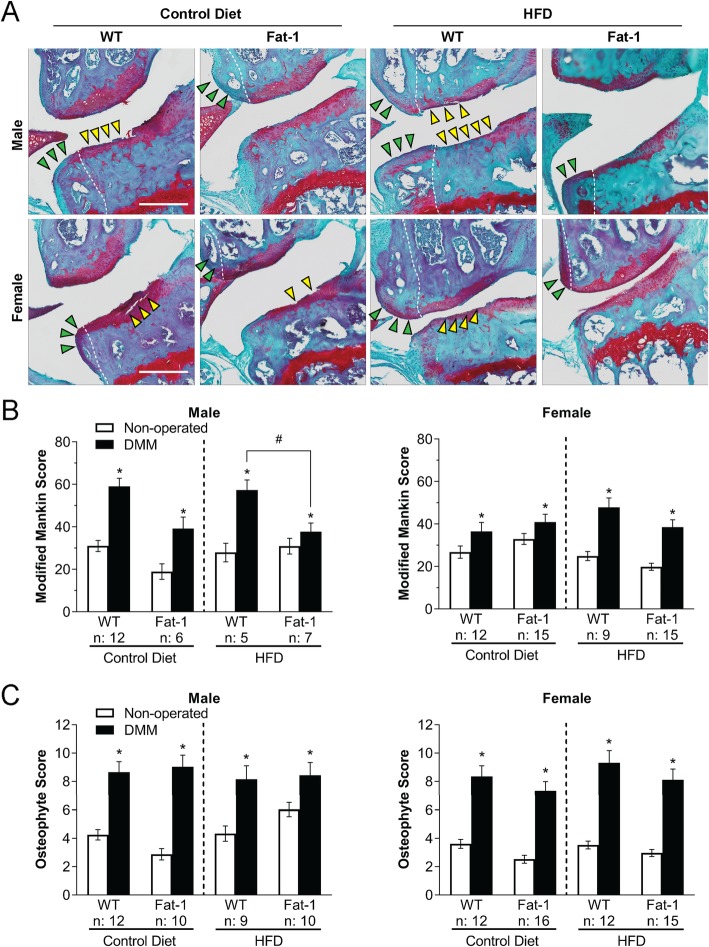
Fig. 2.
a Safranin-O– and Fast Green–stained DMM-operated joints. Yellow arrowheads: severe cartilage loss and damage. Green arrowheads: osteophytes. White dashed lines: boundary between bone and osteophyte. Scale bar = 1 mm. b Modified Mankin score and c osteophyte scores for total joints. Two-way repeated measures ANOVA within the same sex followed by Fisher’s LSD post hoc. *p < 0.05, DMM-operated vs. non-operated joints. #p < 0.05, HFD fat-1 vs. WT DMM-operated joints. The number (n) of the mice used in each group is indicated on plots. Data presented as mean ± SEM

