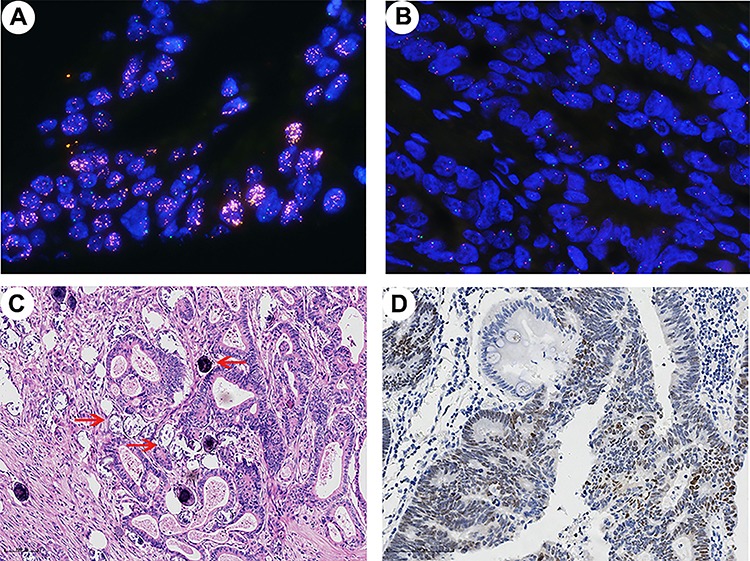
Figure 1.

(A-B) Representative patterns of c-MYC gene by FISH (oil immersion, ×1000). (A) c-MYC amplification (c-MYC:CEP8 ratio = 9.03). (B) c-MYC gene disomy (c-MYC:CEP8 ratio = 0.97). (C) Typical sample of schistosomiasis-associated colorectal cancer, the red arrows indicate schistosome eggs (HE, ×100). (D) Positive staining for c-MYC showed frequent nuclear expression (×200).
