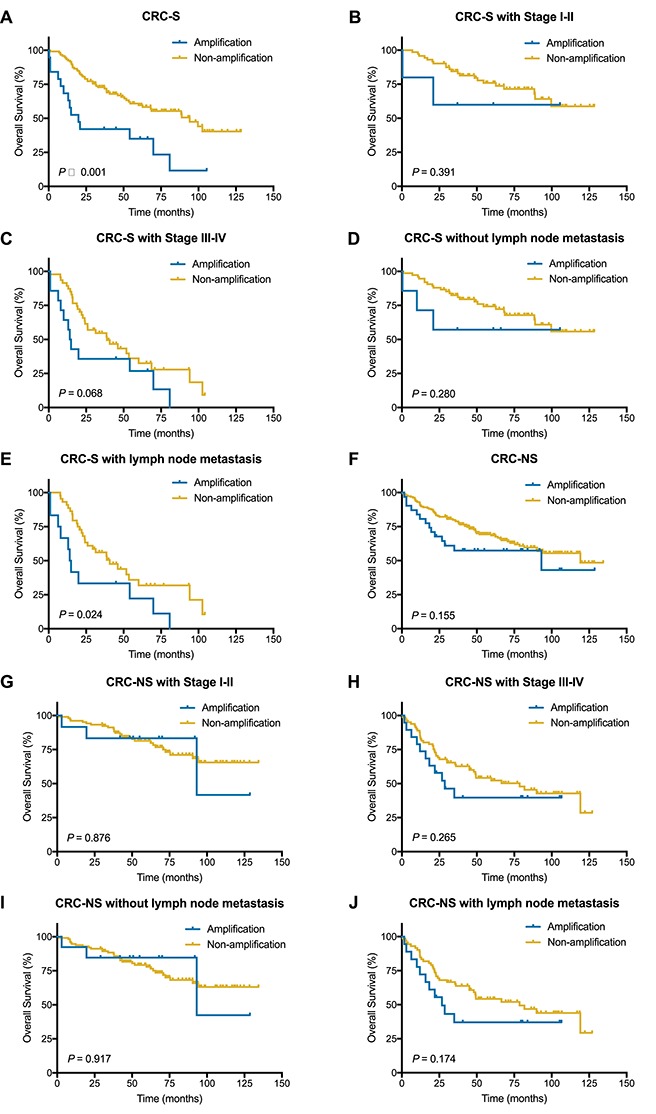
Figure 3.

Kaplan–Meier survival curves illustrating prognostic effects of c-MYC amplification in CRC-S set and CRC-NS set. (A and F) c-MYC amplification for OS in CRC-S set and CRC-NS set. (B and C) c-MYC amplification for OS in CRC-S with stage I-II or stage III or IV. (D and E) c-MYC amplification for OS in CRC-S without or with lymph node metastasis. (G and H) c-MYC amplification for OS in CRC-NS with stage I-II or stage III-IV. (I and J) c-MYC amplification for OS in CRC-NS without or with lymph node metastasis.
