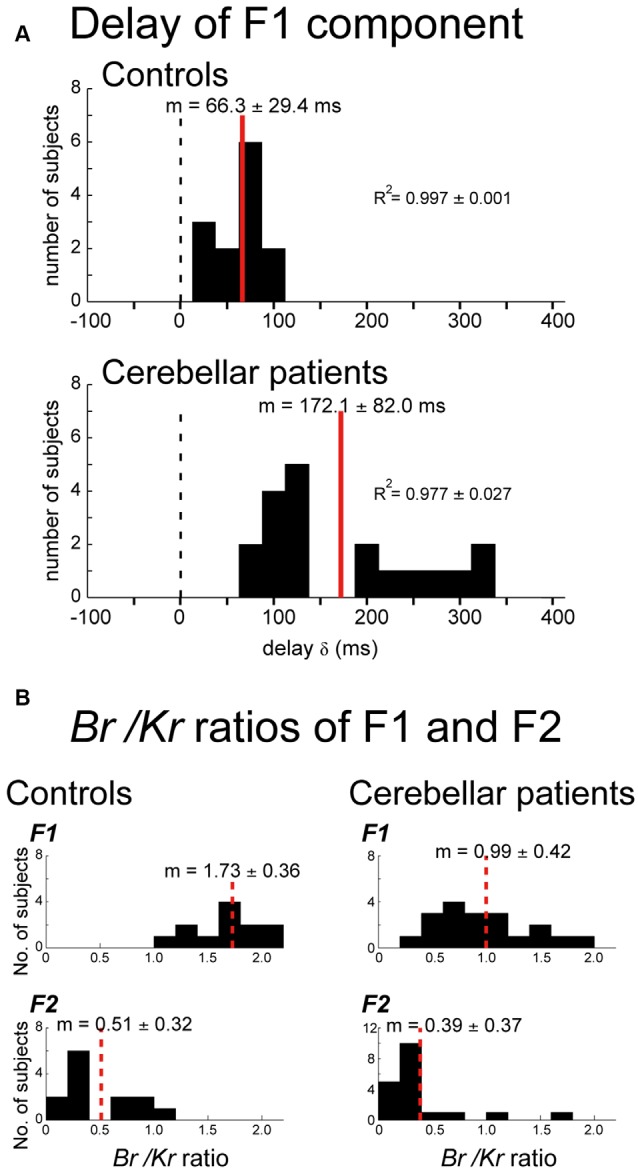
Figure 4.

Changes in movement kinematics of ataxic patients. (A) Delay of the F1 domain of the wrist movement from the target motion. Cross-correlation was calculated by changing the delay δ of the target motion relative to the wrist movement. Controls: Histogram of the optimal delay δ for the control subjects (n = 13). Cerebellar patients: Histogram of the optimal delay δ for the cerebellar patients (n = 19). (B) Comparison of the Br/Kr ratios for the F1 and F2 components between the controls and the cerebellar patients. Controls: Br/Kr ratios of the control subjects for the F1 component (top) and the F2 component (bottom; n = 13). Note the highly significant difference between the two components. Cerebellar patients: Br/Kr ratios of the patients for the F1 (top) and the F2 (bottom) components (n = 19). Note the selective decrease of Br/Kr ratios for the F1 component in the patients. Adapted from Kakei et al. (2019) under CC-BY license.
