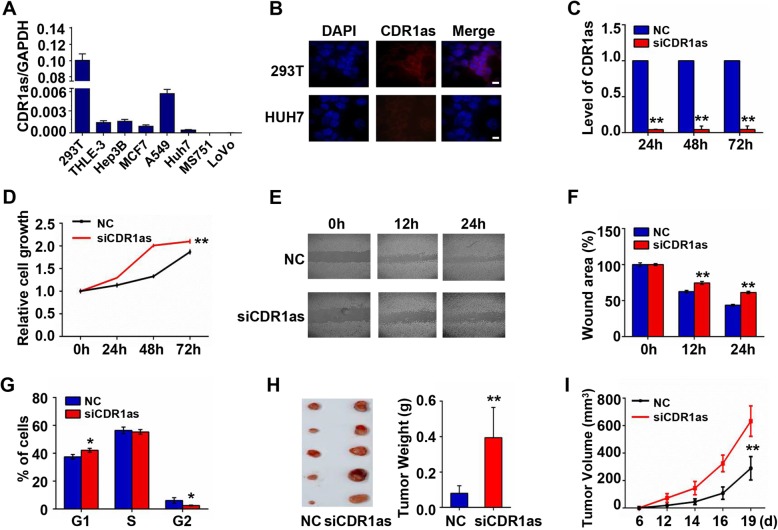
Fig. 1.
Functional effects of CDR1as inhibition in 293 T cells. a Relative CDR1as expression in different cell lines. b RNA FISH assessment of CDR1as in 293 T and Huh7 cells. Scale bar, 10 μm. c CDR1as knockdown efficiency following siCDR1as transfection. d CDR1as knockdown effects on cell proliferation. e & f CDR1as knockdown effects on cell migration. g CDR1as knockdown effects on cell cycle progression. h Xenograft assessment of tumor size and weight in nude mice using 293 T cells in which CDR1as was knocked down (n = 5). i Tumor volumes from mice in (h)

