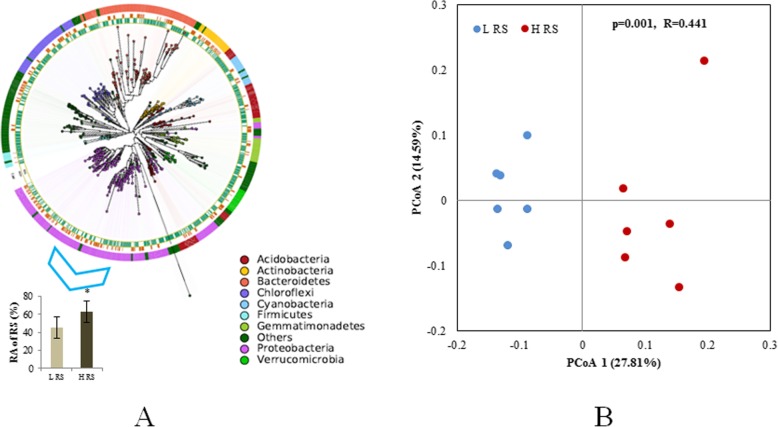
Fig. 2.
a The maximum-likelihood phylogenetic tree of all OTUs clustered. The outer ring shows the taxonomic group, the central ring shows the high abundance of RS group, and the inner ring shows the low abundance of RS group. The relative abundance of RS in two groups were present at the left bottom, and asterisk indicated the significant difference between two groups. b Principal coordinates analysis (PCoA) with Bray-Curtis dissimilarity of the rhizosphere bacterial community in low abundance of RS samples (LRS) and high abundance of RS samples (HRS)

