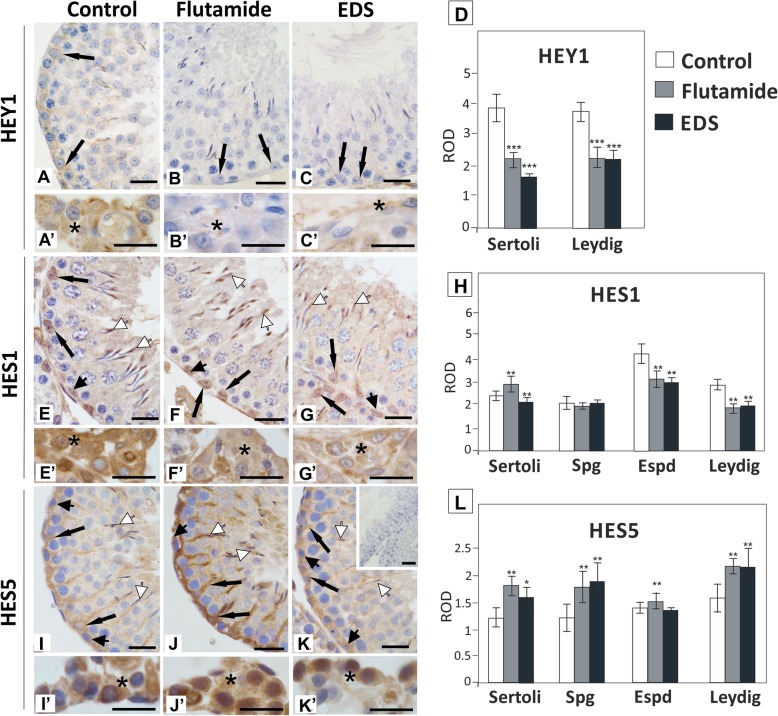
Fig. 7.
Effect of flutamide and EDS on HEY1, HES1 and HES5 immunoexpression in peripubertal rat testis. Representative micrographs are obtained from three independent analyses. Images A – C, E – G, and I - K represent seminiferous tubule sections, images A’ – C′, E’ – G’, and I′ – K′ represent interstitial tissue. Negative control included section incubated with non-immune serum instead of the primary antibody (insert in K). Scale bar = 20 μm. Positive signals of the proteins are depicted by arrows. Sertoli cells – arrows, spermatogonia – arrowheads, elongated spermatids – white arrowheads, Leydig cells – asterisks. Quantitative analysis of the intensity of immunocytochemical stainings expressed as relative optical density (ROD) of diaminobenzidine brown reaction product (D, H, L). The histograms are the quantitative representation after densitometry of data (mean ± SD) of three independent analyses. Significant differences from control values are denoted as *p < 0.05, **p < 0.01, and ***p < 0.001. Spg – spermatogonia, Espd – elongated spermatids

