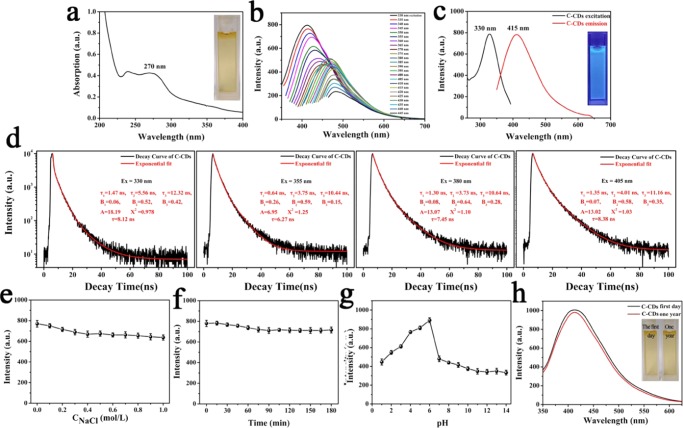
Figure 8.
(a) UV–vis spectra of C-CDs (inset, photographs taken under visible light). (b) FL spectra of C-CDs under different excitation wavelengths. (c) Optimal excitation and emission PL spectra (inset, photographs taken under 365 nm UV light). (d) Fluorescence lifetimes at different excitation wavelengths Ex = 330, 355, 380, and 405 nm of the C-CDs. (e) Effect of ionic strengths on the fluorescence intensity of C-CDs (ionic strengths were controlled by various concentrations of NaCl in the aqueous solution). (f) Effect of time intervals of irradiation with a UV lamp on fluorescence intensity of C-CDs. (g) Effect of pH on the fluorescence intensity of C-CDs. (h) Effects of storage time on the fluorescence intensity of the C-CDs. The insets in (h) show the photographs of the C-CD aqueous solution on the first day and 1 year later. The results are the average and standard deviation over four replicates of the measurements.

