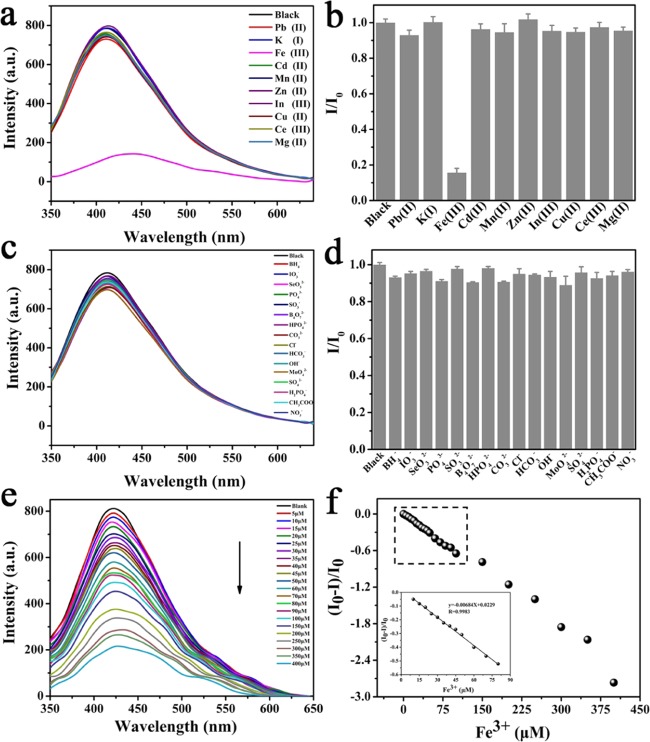
Figure 9.
(a) Emission spectra of the C-CD solution in the presence of 190 μM concentration of Pb2+, K+, Fe3+, Cd2+, Mn2+, Zn2+, In3+, Cu2+, Ce3+, and Mg2+. (b) Relative fluorescence intensity of C-CDs (where I and I0 are the intensities in the presence and absence of the metal ions, respectively). (c) Emission spectra of C-CD solution in the presence of 190 μM concentration of BH4–, IO3–, SeO32–, PO43–, SO32–, B4O72–, HPO42–, CO32–, Cl–, HCO3–, OH–, MoO42–, SO42–, H2PO4–, CH3COO–, and NO3–. (d) Relative fluorescence intensity of C-CDs (where I and I0 are the intensities in the presence and absence of the anions ions, respectively). (e) Quenching of the fluorescence intensity of the C-CD solution in different concentrations of the Fe3+ solution. (f) Plot of (I0 – I)/I0 with different Fe3+ concentrations. Ex = 330 nm; Em = 415 nm; and slit widths of both excitation and emission = 2.5. The results are the average and standard deviation of four replicates of the measurements.

