
Figure 5. Msp300/Nesprin is required for MTOC assembly at the fat body nuclear surface by recruiting Shot and Patronin.
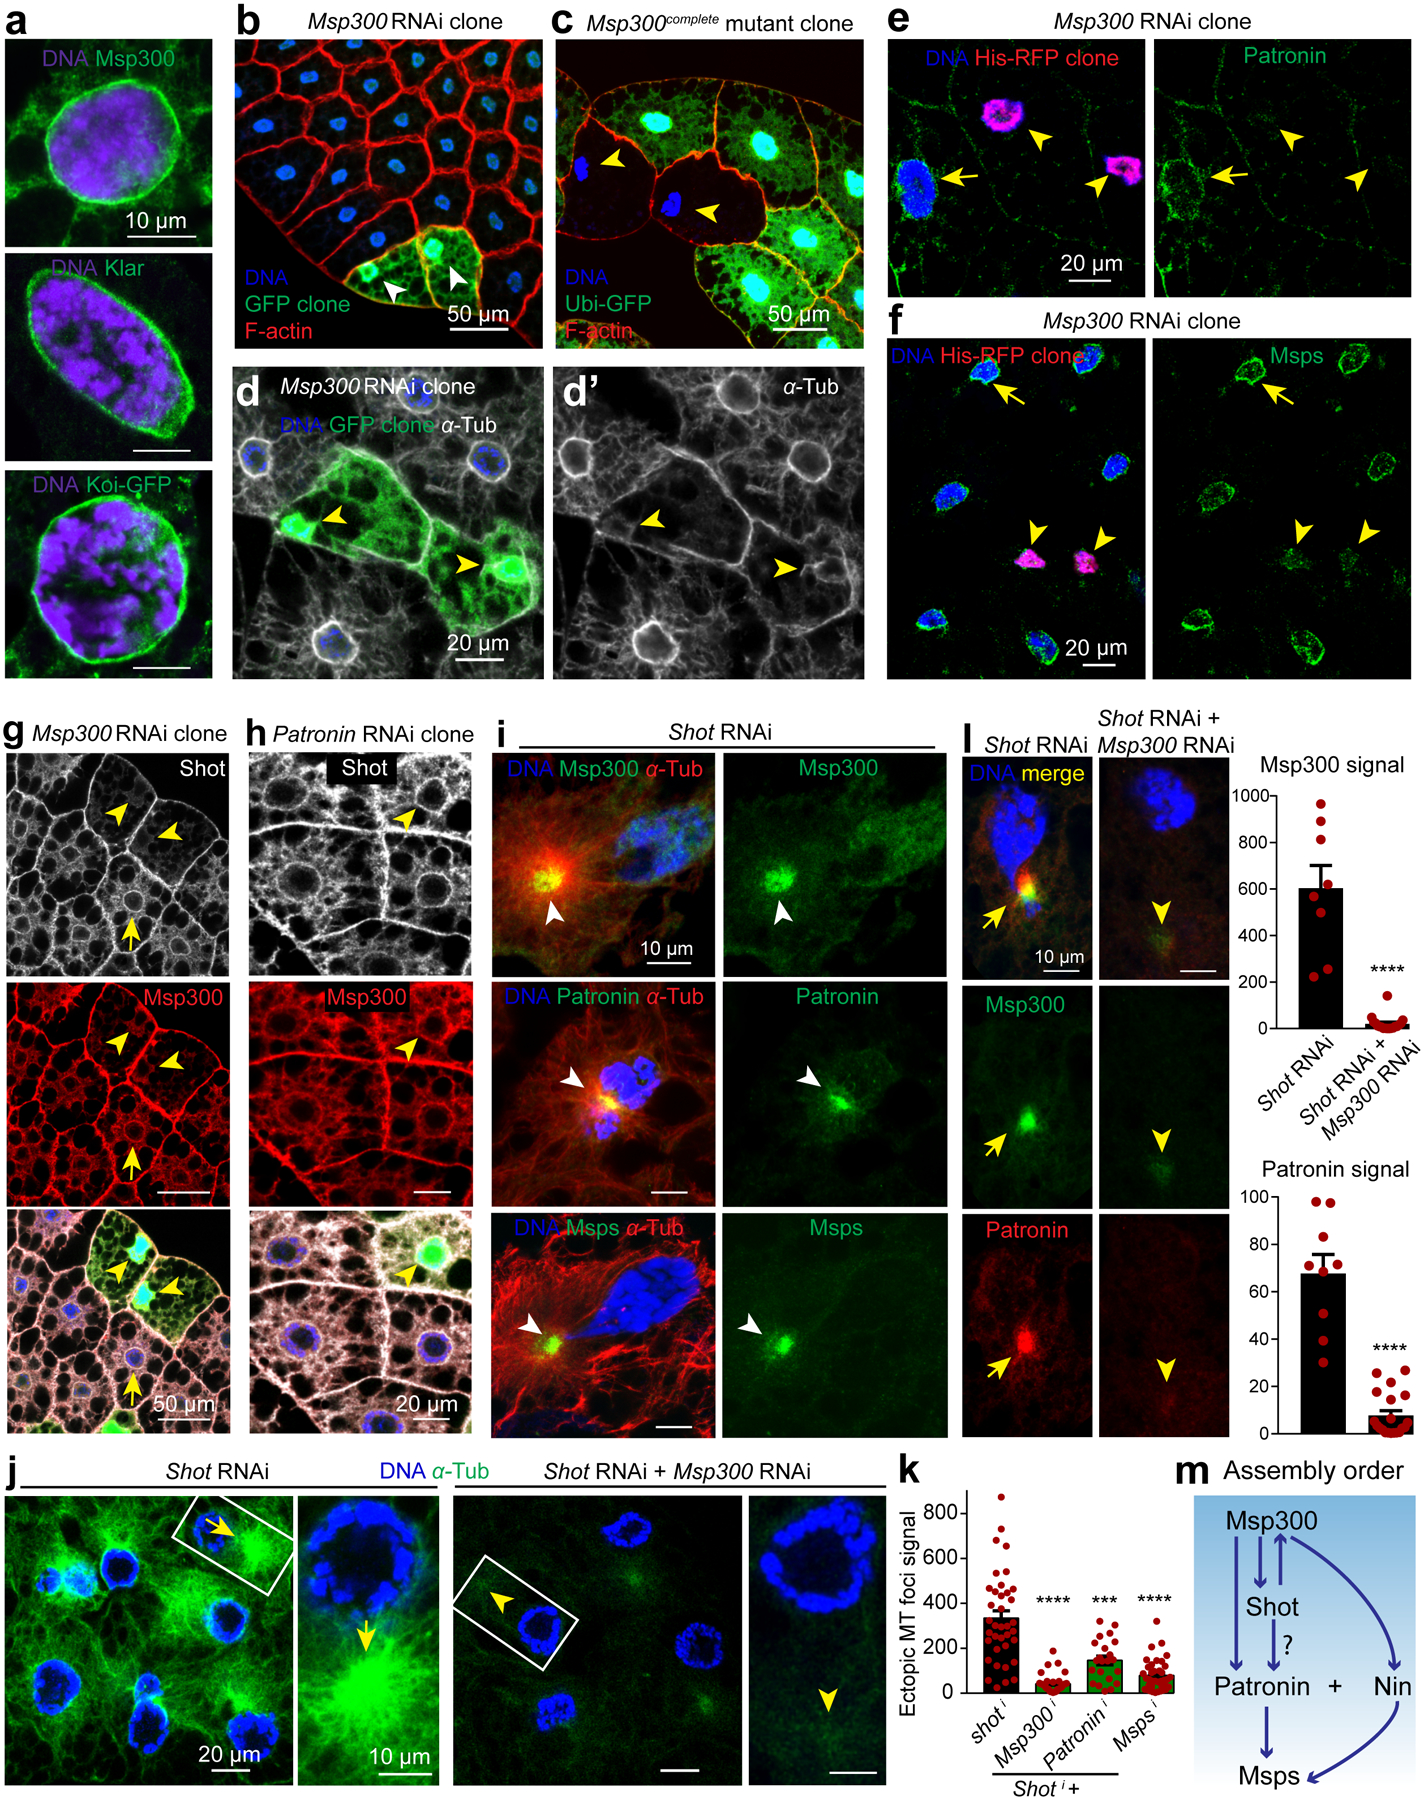
RNAi/mutant clones are marked with arrowheads and controls with arrows throughout figure. (a) LINC complex components localized to the fat body nuclear periphery. (b, c) Msp300 maintains nuclear centricity. Msp300 RNAi clones marked with GFP (b) and mutant clones by loss of GFP expression (c). (d) Circumferential and radial MTs are diminished with Msp300 knockdown. (e) Patronin localization to the nuclear surface is reduced in Msp300 RNAi clones (His-RFP). Quantification of Patronin perinuclear signal: 66.48±10.21 (n=10 control) vs 2.983±0.7863 (n=9 Msp300 RNAi clone), p=0.000019(****). (f) Msps localization to the nuclear surface is reduced in Msp300 RNAi clones marked with His-RFP. Quantification of Msps perinuclear signal: 132.8±11.13 (n=22 control) vs 30.5±10.18 (n=7 Msp300 RNAi clone), p=0.000036(****). (g) Shot localization to the perinuclear MTOC (arrow) is disrupted in Msp300 RNAi clones. (h) Shot and Msp300 localization (antibody staining) to the perinuclear MTOC do not require Patronin. (i) Msp300, Patronin and Msps (antibody staining) are delocalized to an ectopic MTOC in shot knockdown cells. (j) Double knockdown of Msp300 and shot with two combined fat body drivers (SPARC-Gal4+Cg-Gal4) significantly diminished ectopic MT foci compared to shot knockdown alone. (k) Quantification of ectopic MT foci in j and with two other combinations. From left to right, p=8.87e-12(****), p=0.0001(***), p=1.62e-10(****), n=37, 33, 22, 38 independent cells analyzed respectively. (l) Msp300 and Patronin delocalized to ectopic foci by shot RNAi; shot+Msp300 RNAi significantly reduced them. Msp300 signal: p=3.44e-09(****, n=8 shot RNAi, n=18 double RNAi), Patronin signal: p=1.69e-10(****, n=9 shot RNAi, n=20 double RNAi). (m) Epistasis for key components. Experiments were performed three times in a, twice in g, h, five times in i. Quantification for b is in Figure 3a. Images in c, d are representative of 30 and 14 independent clones, respectively. Data in e, f, k, l are presented as the means±s.e.m by two-tailed Student’s t-test; n=number of independent clones (e,f) or cells (k,l) analyzed. Statistical details in Source Data Fig. 5_Statistical Source Data. Scale bar, 10 μm (a, i, l, right panels in j), 50 μm (b, c, g), 20 μm (d, e, f, h, left panels in j).