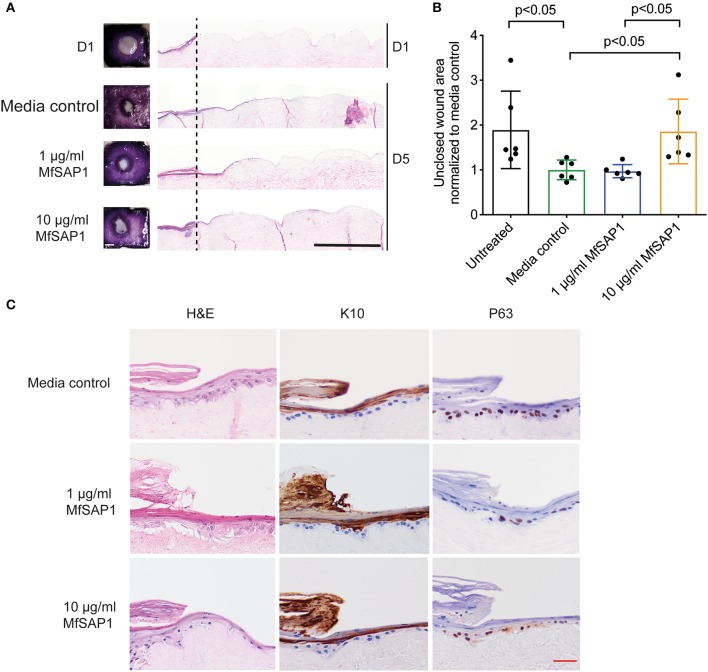
Figure 4.
Effect of MfSAP1 on acute wound closure. (A) MTT staining (left) and hematoxylin and eosin (H&E, right) staining of the DED-HSE sections on Day 1 and Day 5. The dashed line indicates the edge of the punch biopsy. Black scale bar, 1 mm. (B) Quantification of the uncovered wound area as determined by MTT stain using ImageJ. Each wound area sample is normalized to the media control. Error bars represent standard deviation for n = 6 from a total of 3 experimental replicates with technical duplicates. (C) H&E and immunohistochemical analysis of the wound edge on Day 5 for each treatment condition. Representative images are shown from a total of 3 independent experiments. Red scale bar, 50 μm.

