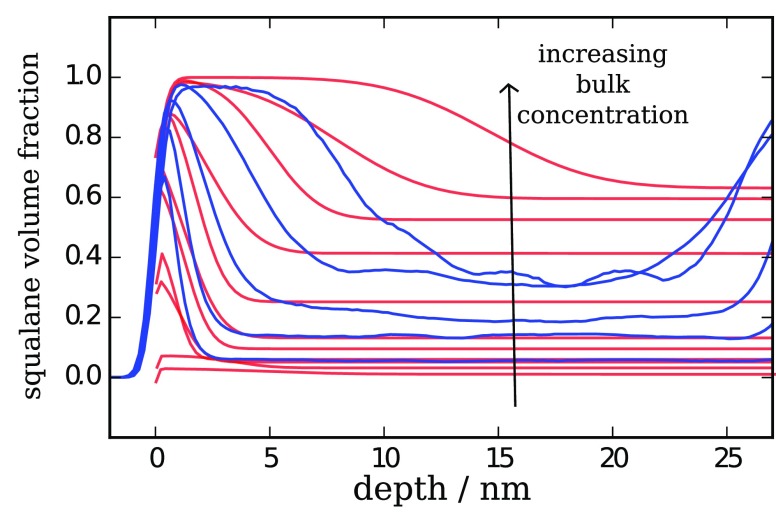
Figure 11.
Squalane concentration profiles at a PB surface. A semiquantitative comparison is shown for experimental neutron reflectometry (red) and coarse-grained molecular dynamics simulation results (blue) at a series of d-squalane concentrations. Red lines show the changing profile for increasing concentrations of bulk d-squalene: 2, 4, 6, 8, 10, 14, 30, 40, 50, 60, and 70% (w/w). Blue lines show the effect of increasing the initial bulk concentration of squalane in a series of simulations. Note that for the CGMD results the second surface at roughly 30 nm impacts the bulk region for higher concentrations, and surface enrichment significantly reduces the bulk concentration within the simulation.

