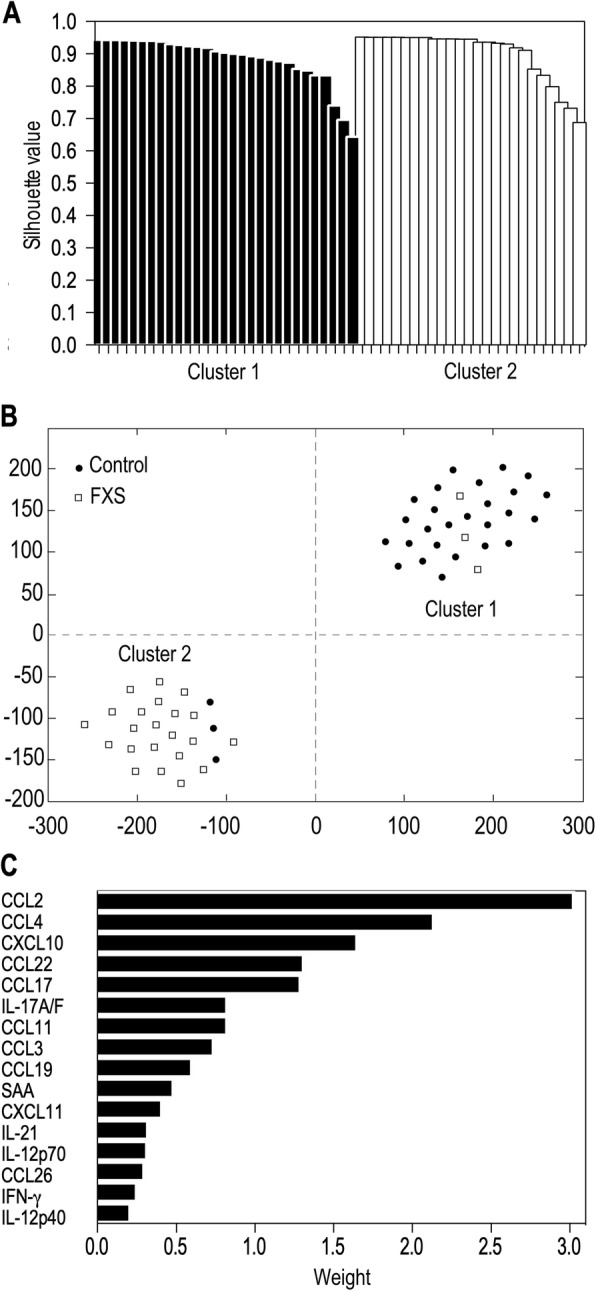
Fig. 2.

K-sparse clustering analysis reveals clear discrimination of FXS patients from healthy controls based on biomarkers levels. a t-Distributed Stochastic Neighbour Embedding (t-SNE) graphical output of K-sparse clustering analysis with 2 clusters. b Performance of the model evaluated using the individual silhouette scores. Each column represents one individual and its individual silhouette value evaluating its parenthood with underlying cluster. c Combination of discriminating features for K-sparse clustering, with their corresponding norm of weights (norm of their associated row in the W matrix, see Additional file 6: Table S5)
