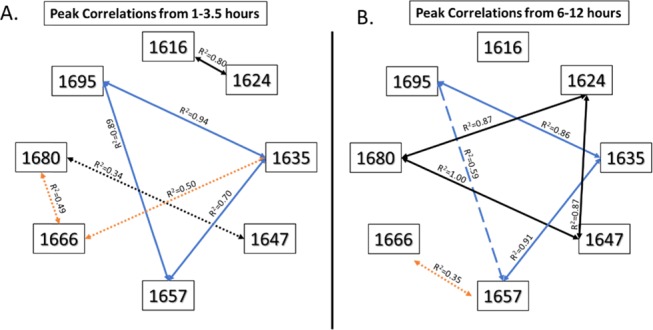
Figure 3.

Positive correlations between peaks at three-time intervals that show a prevailing association between the peaks at 1635, 1657, and 1695 cm–1 (blue lines), which suggests that these peaks rely on each other’s presence to maintain their stability. A dynamic relationship is seen between these three peaks and the one at 1666 cm–1, which indicates a shift in the type of secondary structures being formed. Weak correlations are denoted by dotted lines, moderate correlations by dashed lines, and strong correlations by solid lines. The blue lines indicate the relationship between 1635, 1657, and 1695 cm–1; black lines show the relationship between 1616, 1624, 1647, and 1680 cm–1; orange lines indicate relationships to the peak at 1666 cm–1.
