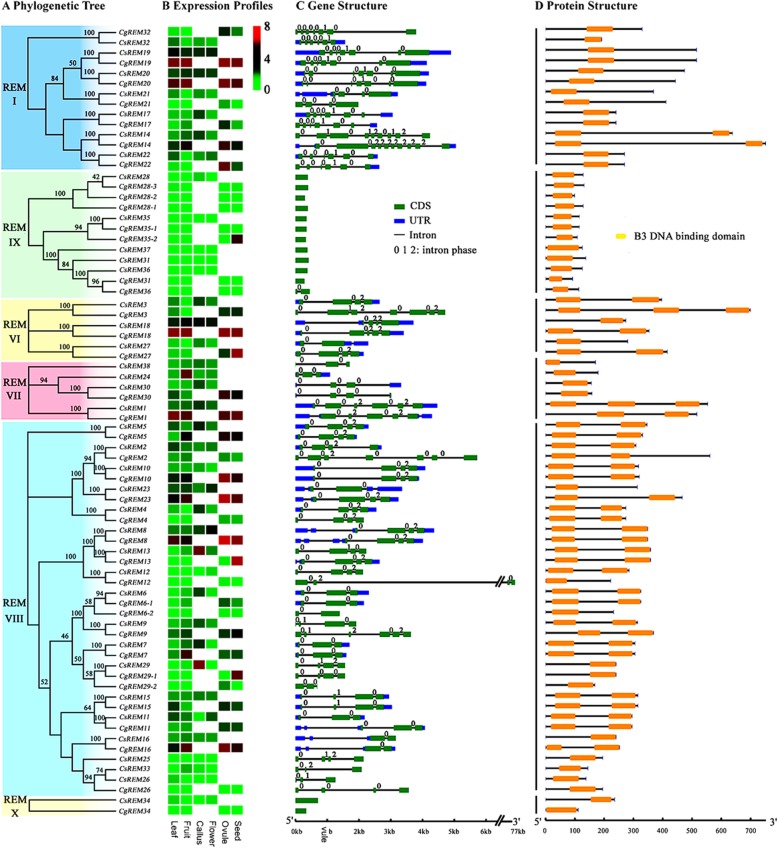
Fig. 4.
Phylogenetic relationships, expression profiles, gene structure and protein structure of citrus B3 genes from the REM family. a Neighbor-joining trees constructed for B3 genes from the REM family. b Heatmap showing the expression of B3 genes in different tissues, including four from sweet orange (leaf, fruit, callus and flower) and four from pummelo (leaf, fruit, ovule and seed). Color gradient from red-to-green indicates expression values change from high to low. c Structure of B3 genes with exon(s) in green, UTR regions in blue, and solid lines between the colored boxes indicating introns. The number indicates the phases of the corresponding introns. d Structure of B3 proteins with the B3 DNA binding domain(s) represented by orange boxes

