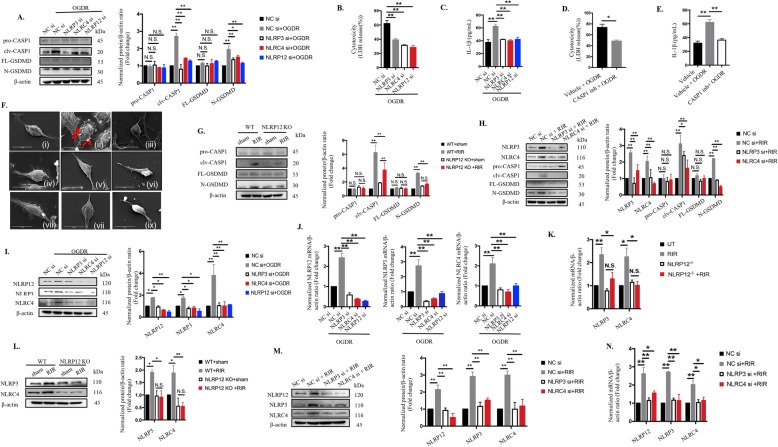
Fig. 3.
NLRP12 collaborates with NLRP3 and NLRC4 to elicit pyroptosis and promote IL-1β production in ischemic injury through CASP1-dependent GSDMD cleavage a-h NLRP12/NLRP3/NLRC4 promoted IL-1β release and induced pyroptosis by CASP1-dependent GSDMD cleavage: a Knockdown of NLRP12/NLRP3/NLRC4 reduced CASP1 and GSDMD cleavage in extracts from BV2 microglia after OGDR injury, as determined by western blot analysis (n = 6). The protein levels were normalized to β-actin levels. b LDH release (n = 6). c IL-1β secretion (n = 6). d-e LDH release (d) and IL-1β production (e) of BV2 microglia treated with the CASP1 inh, YVAD (200 µM) and subjected to OGDR injury (n = 6). f Representative SEM images showed pyroptotic cell death and other morphological changes in BV2 microglia subjected to OGDR combined with or without different additional treatments (n = 5): (i): control; (ii): OGDR; (iii): OGDR plus CASP1 inh (YVAD, 200 µM); (iv): OGDR plus NLRP3 siRNA (si); (v): OGDR plus NLRP12 si; (vi): OGDR plus NLRC4 si; (vii): CASP8 CRISPR plus OGDR; (viii): OGDR plus HIF-1α si ; (ix): OGDR plus IL-1β neutralizing antibody. Scale bar: 20 µm. g-h Immunoblotting analysis for detection of pyroptotic proteins in the retinas of NLRP12-/- or WT mice with or without NLRP3/NLRC4 knockdown under RIR conditions (n = 6). The protein levels were normalized to β-actin levels. i-n Mutual regulatory relationships among NLRP12, NLRP3 and NLRC4: i-j Protein expression and mRNA levels of the indicated molecules, as determined by western blotting and qRT-PCR detection in BV2 microglia exposed to OGDR with or without NLRP3/NLRP12/NLRC4 knockdown (n = 6). The mRNA and protein levels were normalized to β-actin levels. k-n Western blotting and qRT-PCR analyses of NLRP3, NLRP12, and NLRC4 in retinas from WT mice and NLRP12 KO mice that were sacrificed 7 days after elevated IOP injury, combined with or without NLRP3/NLRC4 knockdown (n = 6). The mRNA and protein levels were normalized to β-actin levels. The data shown are representative of at least three independent experiments. The data are represented as the mean ± SD. *P < 0.05, **P < 0.01, one-way ANOVA, two-way ANOVA and two-tailed unpaired t-test.

