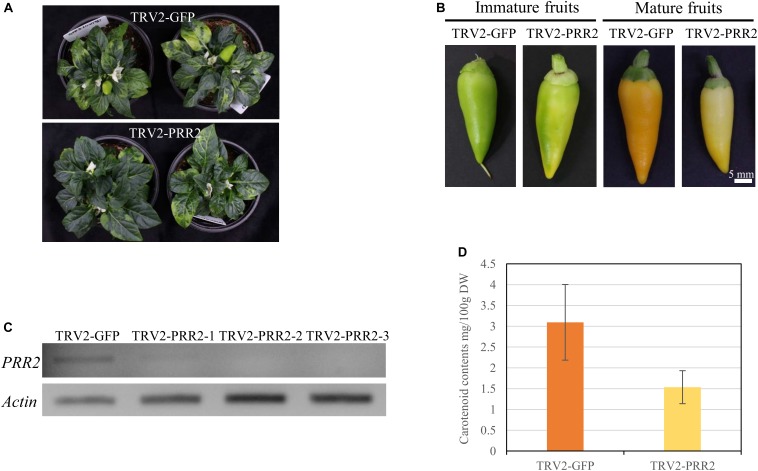
FIGURE 5.
VIGS of PRR2 in MY. (A) Phenotypes of TRV2-GFP-inoculated MY (top) and TRV2-PRR2-inoculated MY (bottom) plants at 60 days after inoculation (DAI). (B) Effect of the VIGS of GFP and PRR2 on the color of immature and mature fruit. Scale bar, 5 mm. (C) Expression analysis of PRR2 using RT-PCR. Three biological replicates of PRR2-silenced fruits were used. Actin served as a control. (D) Total carotenoid contents of TRV2-GFP- or TRV2-PRR2-inoculated MY fruits. The standard deviation of carotenoid contents of TRV2-GFP- or TRV2-PRR2-inoculated MY fruits were 0.909484 and 0.396838, respectively, with the p-value of 0.09078 using Student’s t-test. TRV2-GFP was used as a vector control.

