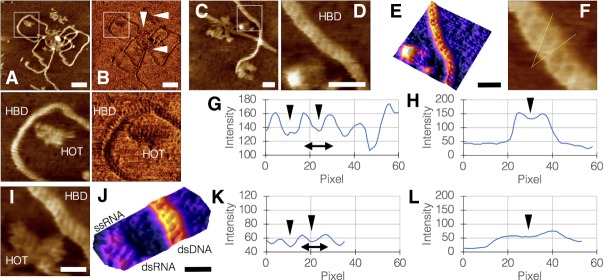
FIGURE 4.
High-resolution imaging of DNA and RNA by AFM. (A,B) HOTAIR molecules interacting with HBD1, imaged by height (A) and phase (B), the latter showing differences between HBD1 and HOTAIR molecules based on the higher rigidity of DNA compared with the softer RNA. Bottom panels are magnifications of white squares in A and B (bar = 50 nm). (C,D) Segment from a HOTAIR:HBD1 sample focusing on the dsDNA structure, D is a magnification of white square in C, showing the right-handed double helix (bar in C = 20 nm; bar in D = 10 nm). (E) 3D surface plot of D (bar = 10 nm). (F) Helical twist angle measurement, yielding 31.89° relative to helix plane. (G) Plot profile along the axis showing the major grooves (black arrowheads) and helical pitch (double-sided arrow) of 3.76 nm. (H) Plot profile orthogonal to the axis. Black arrowhead pointing at oblique segment of a major groove. (I) Segment of a HOTAIR:HBD1 sample showing dsDNA, dsRNA, and ssRNA together in a single frame (bar = 10 nm). (J) 3D surface plot of I, emphasizing the different structures in the sample (bar = 10 nm). (K) Plot profile along the axis showing the major grooves (black arrowheads) and helical pitch (double-sided arrow) of 2.89 nm. (L) Plot profile orthogonal to the axis. Black arrowhead pointing at oblique segment of a major groove. Note the lower profile of dsRNA compared with dsDNA (H) due to RNA being softer than DNA.

