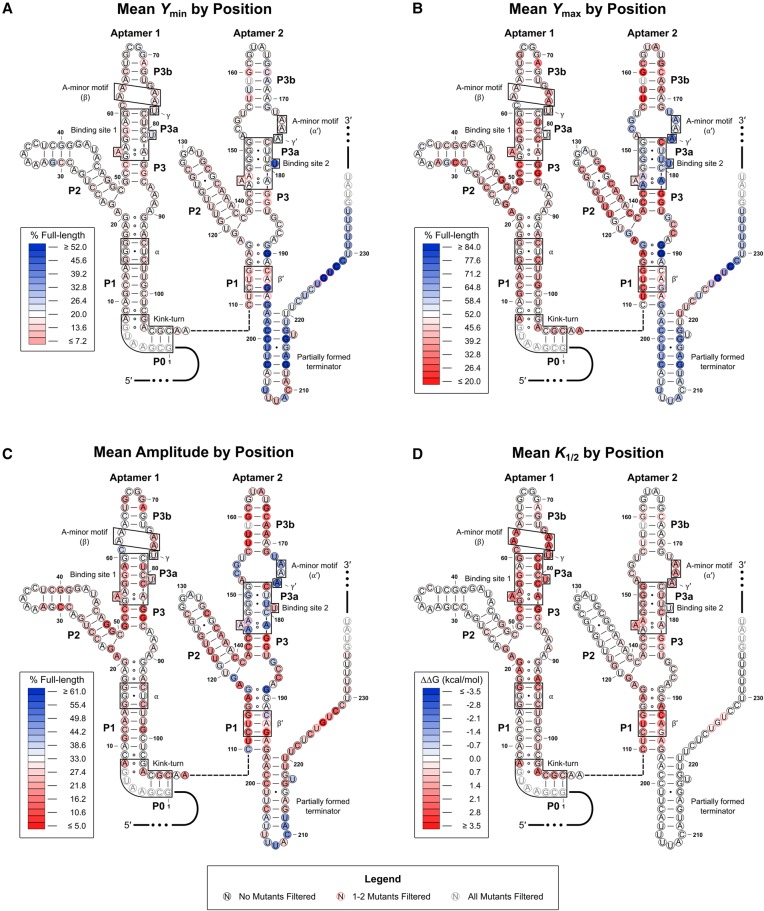
FIGURE 4.
Heat maps associated with the WT construct. The mean Ymin (A), Ymax (B), amplitude (C), and K1/2 (D) values for the three single-point mutants at each position are mapped onto the predicted RNA secondary structure. Mutations with error values larger than the generated parameter value for amplitude or K1/2 were excluded from the mean values plotted. Mutants were also filtered if the amplitude value generated was <5% or >100%. Positions with one to two mutants excluded are denoted by a red border. Positions where all three mutant constructs were excluded are grayed out. Heat map scales are based on the parameter values generated for the WT construct. White-filled circles denote that the parameter value is approximately equal to the WT value. Red-filled circles denote that the parameter value has decreased relative to WT, and blue-filled circles denote that the value has increased relative to WT. For K1/2, the apparent change in free energy (ΔΔG) is mapped. This was done as cumulative effects associated with this parameter are expected to be multiplicative rather than additive given the relationship between K1/2 and binding affinity. As such, negative values (which are associated with a lower K1/2 value) are depicted in blue and positive values (associated with a higher K1/2 value) are depicted in red.

