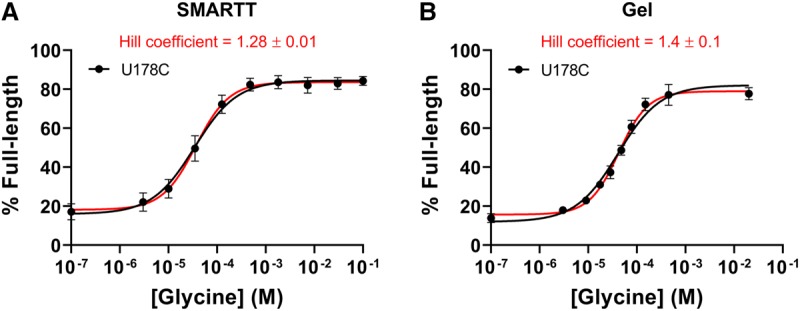
FIGURE 7.

Transcription termination profile of U178C. The transcription termination profile of U178C obtained by SMARTT (A) or the conventional gel-based assay (B). Fits to the one-site equation are shown in black. Fits to the Hill equation are shown in red. Error bars represent the standard deviation across two (SMARTT) or three (gel) replicates at each data point.
