FIGURE 3.
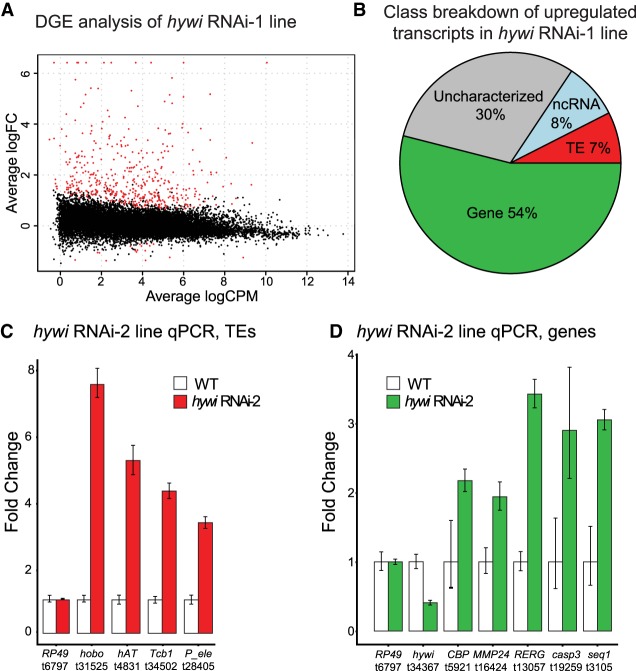
Both TE and non-TE transcripts are up-regulated in response to epithelial hywi RNAi. (A) DGE analysis was performed to compare transcript expression levels between hywi RNAi animals and WT siblings; knockdown animals carry the hywi RNA-1 transgene (Juliano et al. 2014). Plot showing 458 differentially expressed transcripts (red); 441 transcripts are up-regulated and 17 transcripts are down-regulated (adjusted P-value <0.05). (B) Transcript class breakdown of the 441 transcripts up-regulated in response to hywi knockdown. (C,D) A second RNAi transgenic line (hywi RNAi-2) was used to validate the DGE results (Juliano et al. 2014). qPCR was used to test the levels of select (C) TE transcripts and (D) gene transcripts identified by the DGE performed on the hywi RNAi-1 transgenic line. Error bars reflect standard deviation. These results indicate that at least some transcripts up-regulated in the hywi RNAi-1 transgenic line are also up-regulated in the hywi RNAi-2 transgenic line, suggesting the specific effect of hywi knockdown.

