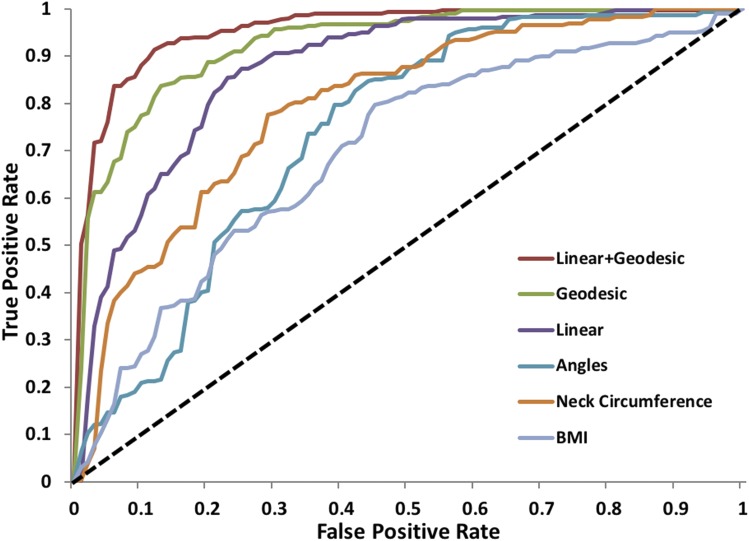
Figure 3. Receiver operating characteristic curves showing the sensitivity and specificity for predicting OSA (AHI ≥ 5 events/h) using different landmarks or anthropometric measurements.
AHI = apnea-hypopnea index, BMI = body mass index, NC = neck circumference, OSA = obstructive sleep apnea, true negative rate (specificity), true positive rate (sensitivity).

