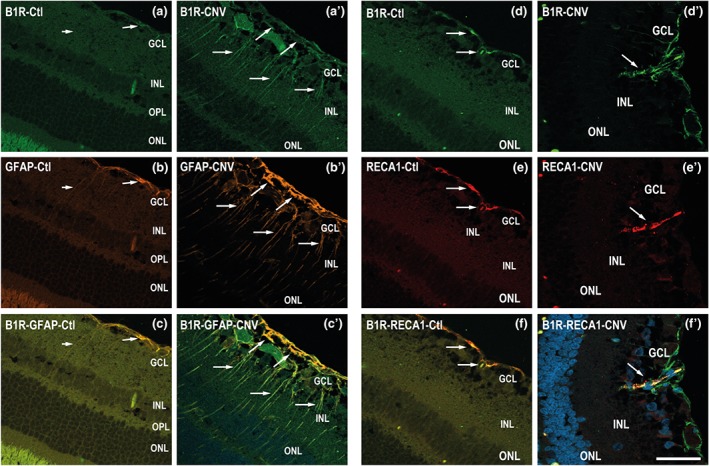
Figure 3.

Micrographs of cellular distribution of B1 receptors on glial and endothelial cells. Representative micrographs of immunolabeling for B1 receptors (green), GFAP (orange), and RECA1 (red) in control (Ctl) and CNV retinas. Sections are counterstained for DAPI (blue) which labels cell nuclei. Note that B1 receptors co‐localized (yellow, arrows) with GFAP (panel c′) and RECA‐1 (panel f′) in CNV retina and to some extent in control retina (c, f). Data are from four rats. Scale bar: 75 μm. B1R, B1 receptors
