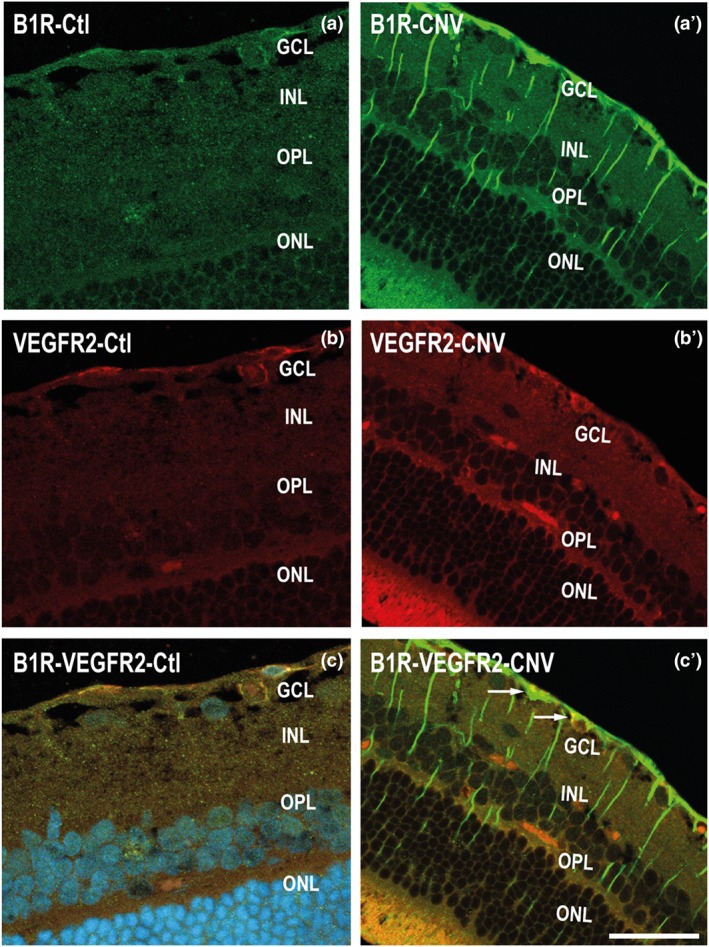
Figure 5.

Micrographs of cellular distribution of B1 receptors on VEGF‐R2. Representative micrographs of immunolabelling for B1 receptors (green) and VEGF‐R2 (red) in control (Ctl) and CNV retinas. B1 receptors and VEGF‐R2 are co‐expressed partly (yellow) in the GCL layer of CNV retina (panel c′). Data are from four rats. Scale bar: 75 μm. B1R, B1 receptors
