Figure 6.

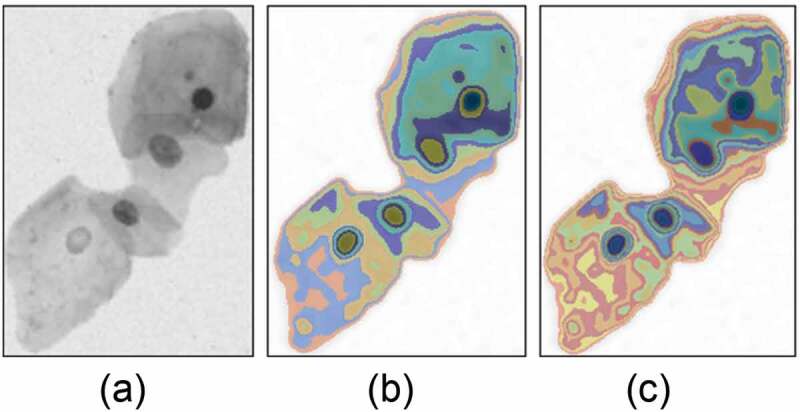
FCM segmentation of the cell clump with clustering category K = 10 and K = 20. (a) The original image. (b) The segmented result with clustering category K = 10. (c) The result with K = 20.

FCM segmentation of the cell clump with clustering category K = 10 and K = 20. (a) The original image. (b) The segmented result with clustering category K = 10. (c) The result with K = 20.