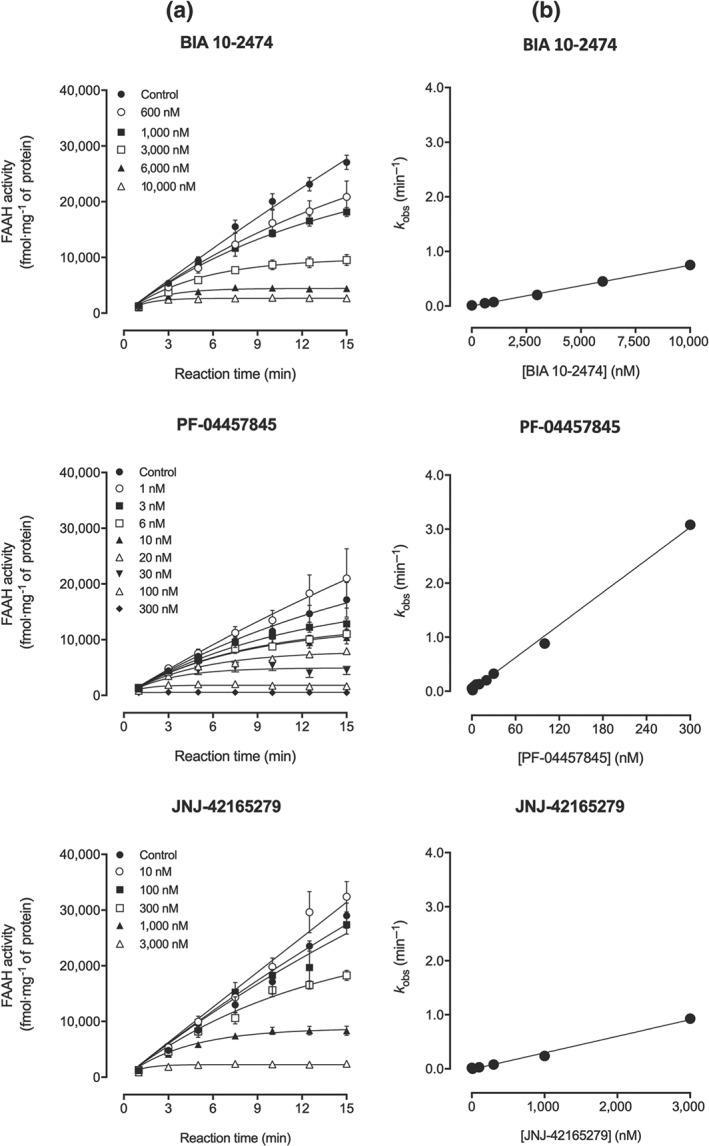
Figure 1.

(a) Progression curves of rat brain fatty acid amide hydrolase( FAAH) activity determined in the presence of BIA 10‐2474 (600 nM to 10 μM) or PF‐04457845 (1 to 300 nM) or JNJ‐42165279 (10 nM to 3 μM). (b) From each curve was derived a k obs value that was plotted function of inhibitor concentrations. Results are means ± SEM (n = 4 except for BIA 10‐2474 1 μM, PF‐04457845 10 nM, and controls of these two compounds where n = 8) as obtained from GraphPad Prism 6 for Windows
