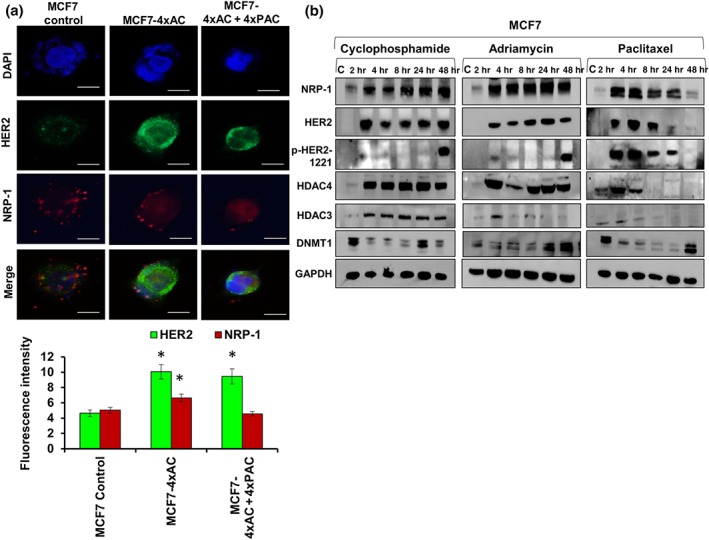
Figure 3.

Immunofluorescent staining in resistant cells and after short period treatments with individual drugs in MCF7 cells confirmed the up‐regulation of HER2 and NRP‐1. (a) Fluorescence intensity of at least 15 cells showed a significant increase of NRP‐1 in resistant cells to 4xAC only. HER2 overexpression was detected in resistant cells to both 4xAC and 4xAC + 4xPAC. Fluorescence intensity was measured by ImageJ software, and the data are means ± SD, * P < .05, significantly different from control cells; ANOVA and Tukey's post hoc test. Images were captured at the same exposure using the 40× objective, scale bar = 100 μm. (b) Short period treatments with either of the three drugs cyclophosphamide, doxorubicin (adriamycin) or paclitaxel showed a rapid induction of NRP‐1, HER2, HDAC3, and HDAC4. Phosphorylated HER2 at site 1221 was up‐regulated after 48 hr of cyclophosphamide or adriamycin treatment. Paclitaxel increased the level of p‐HER2 (1221) after 2 and 4 hr of treatment but decreased after 8 and 24 hr and further reduced after 48 hr. Finally, DNMT1 had a different expression pattern in response to either of the three used drugs. The densitometry quantification of the protein bands from five independent experiments (n = 5) can be found in Figures S2–S4
