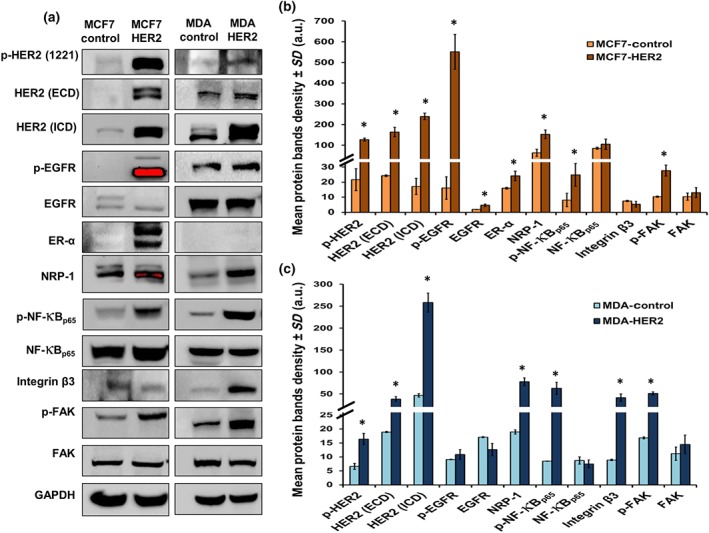
Figure 4.

HER2 transfection triggered the features observed in resistant MCF7 cells. (a, b) MCF7‐HER2 cells exhibited a significant up‐regulation of phosphorylated HER2, HER2‐ICD, HER2‐ECD and EGFR, ER‐α, NRP‐1, p‐NF‐κBp65, and p‐FAK with a decrease in the levels of integrin β3. On the other hand, (a, c) MDA‐HER2 cells exhibited significant increase in phosphorylated HER2, HER2‐ICD, HER2‐ECD, NRP‐1, p‐NF‐κBp65, integrin β3, and p‐FAK. EGFR and p‐EGFR were not changed in the transfected cells. There were no bands of ER‐α detected in MDA control nor in the MDA‐HER2, and a positive control of this white blot can be found in Figure S6. Individual protein band density quantification was normalized against their corresponding GAPDH bands. Data are presented as the mean relative density (arbitrary units, a.u.) ± SD (n = 5). *P < .05 significantly different from control cells; two‐tailed Student's t test
