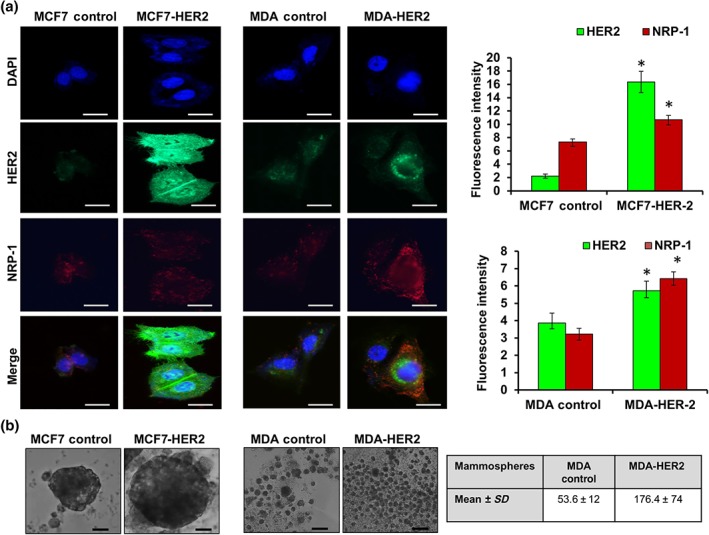
Figure 5.

Dual immunofluorescence staining confirmed the up‐regulation of HER2 (green) and NRP‐1 (red) in HER2‐transfected cells. (a) Notably, in MCF7‐HER2 cells, HER2 was significantly overexpressed and showed a cytoplasmic and nuclear staining, which was high enough to mask NRP‐1 staining in the overlaid image. In MDA‐HER2 cells, NRP‐1 was significantly increased and detected in the cell membrane and cytoplasm; however, HER2 surrounded the nucleus. Images were captured at the same exposure using the 40× objective, scale bar = 100 μm. Fluorescence intensity was measured by ImageJ software, and the data were presented as mean value ± SD, two‐tailed t test was performed, and * P < .05 was the cut‐off for significance. (b) MCF7‐HER2 formed larger spheroids compared with MCF7 control. MDA‐HER2 formed greater numbers of mammospheres (mean ± SD, 176.4 ± 74) relative to MDA‐MB‐231 control cells (mean ± SD, 53.6 ± 12), scale bar = 500 μm. All data are from five independent experiments (n = 5). * P < .05 significantly different from control cells; two‐tailed Student's t test
