Figure 6.

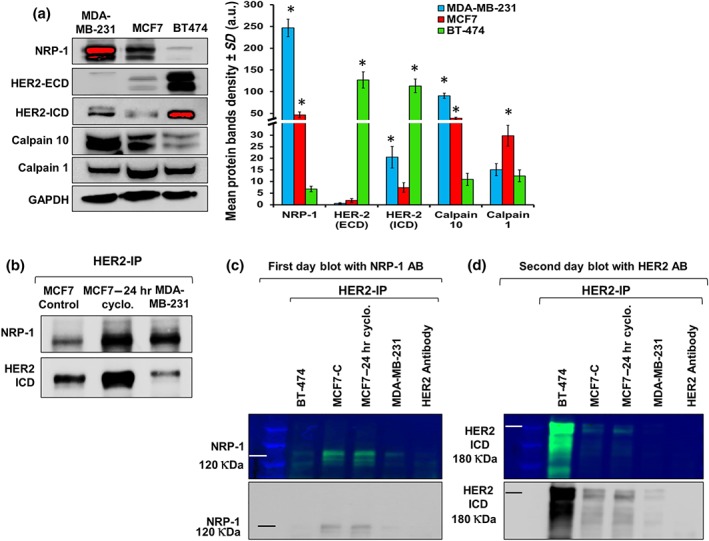
Co‐immunoprecipitation revealed that HER2 binds NRP‐1 in a pattern differing between breast cancer cell lines. (a) Baseline levels of NRP‐1, HER2‐ECD, HER2‐ICD, calpain 10, and calpain 1 were determined in the three breast cancer cell lines (MDA‐MB‐231, MCF7, and BT‐474). MDA‐MB‐231 cells expressed the highest levels of NRP‐1, MCF7 cells expressed moderate levels, and BT‐474 cells expressed the least levels of the protein. The levels of HER2‐ECD exhibited an opposite expression pattern to the levels of NRP‐1. MDA‐MB‐231 cells expressed the least levels of HER2‐ECD, MCF7 cells expressed very low levels, and BT‐474 cells expressed the highest levels of the protein. However, HER2‐ICD was expressed in higher levels in MDA‐MB‐231 cells compared with the levels in MCF7 and were less than the levels detected in BT‐474 cells. The different HER2 band size and pattern in MCF7 and MDA‐MB‐231 cells was explained by the levels of the cysteine proteases calpain 10 and calpain 1 levels. Calpain 10 was expressed in significantly higher levels in MDA‐MB‐231 cells compared with the levels in MCF7 and BT‐474 cells, while calpain 1 had the opposite pattern of expression in the three cell lines. Densitometry quantification (n = 5) of the proteins is presented as the mean relative density (arbitrary units, a.u.) ± SD (n = 5). * P < .05, significantly different from control cells; ANOVA and Tukey's post hoc test. (b) Western blot analysis of MCF7, MCF7 treated with cyclophosphamide for 24 hr, and MDA‐MB‐231 cells showed NRP‐1 band of 120 kDa in the immunoprecipitated (IP) samples using HER2‐ICD antibody. Re‐blotting the same membrane with HER2 confirmed the binding between the two proteins. (c, d) Western blot analysis containing IP eluted proteins using HER2‐ICD antibody that were blotted in the first day with NRP‐1 and HER2 in the second day. The multichannel coloured western blot images were displayed to show the protein molecular marker. (c) MCF7 cells and MCF7 cells treated with cyclophosphamide for 24 hr showed NRP‐1 band when protein lysate was immunoprecipitated using HER2‐ICD, and very faint NRP‐1 band was detected in BT‐474 and MDA‐MB‐231 cells. (d) Second day blot re‐incubated with HER2 antibody showed that HER2 was highly expressed in BT‐474, moderately expressed in MCF7 and MCF7‐treated cyclophosphamide cells, and very low levels were detected in MDA‐MB‐231 cells. The experimental data are from five independent experiments (n = 5)
