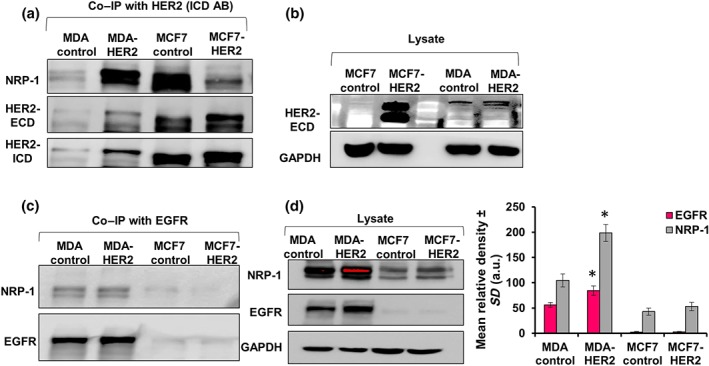
Figure 7.

HER2 overexpression in MDA‐MB‐231 (MDA‐HER2) and MCF7 (MCF7‐HER2) cells confirmed the binding between HER2 and NRP‐1. (a) HER2 IP and NRP‐1 blotting did not show a strong NRP‐1 band in MDA‐MB‐231 control cells; however, in MDA‐HER2 cells, a strong NRP‐1 band was detected. Conversely, MCF7 control cells showed a strong NRP‐1 band, and MCF7‐HER2 cells did not show a strong NRP‐1 band. Re‐blotting the same membrane showed the expression levels of immunoprecipitated HER2 detected using the antibodies recognizing the ECD and ICD. Clearly, the immunoprecipitated levels of HER2 (ECD and ICD) were higher in MCF7 cells compared with MDA‐MB‐231 cells. (b) Baseline HER2 (ECD) levels in the cell's lysate used in blot A extracted from MCF7 control and MCF7‐HER2 cells as well as MDA‐MB‐231 control and MDA‐HER2 cells showed different band expression pattern and size of HER2 protein between the two cells and their transfected forms. (c) Immunoprecipitating EGFR and blotting with NRP‐1 followed by re‐blotting with EGFR showed that EGFR was able to pull NRP‐1 in MDA‐MB‐231 control and MDA‐HER2 cells in a higher capacity compared with both MCF7 control and MCF7‐HER2 cells. (d) Baseline NRP‐1 and EGFR levels in the cell's lysate used in blot C showed that both NRP‐1 and EGFR proteins were significantly higher in MDA‐MB‐231 cells compared with MCF7 cells. Expressed levels of NRP‐1 and EGFR were significantly higher in MDA‐HER2 compared with MDA‐MB‐231 control cells. The experiments were performed independently for five times (n = 5). Individual protein band density quantification was normalized against their corresponding GAPDH bands. Data are presented as the mean relative density (arbitrary units, a.u.) ± SD (n = 5). *P < .05 significantly different from control cells; two‐tailed Student's t test
