Figure 8.

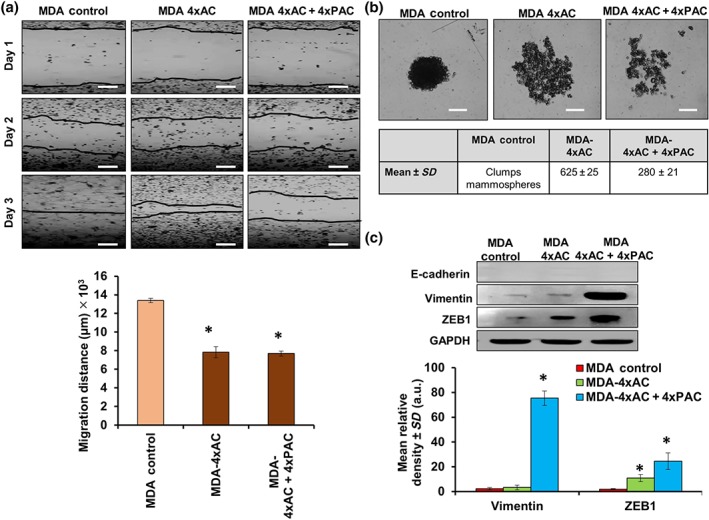
Resistant MDA‐MB‐231 cells exhibited less migration and up‐regulated EMT‐related proteins. (a) Phase‐contrast images show that the wound healing process was slower in MDA‐MB‐231 cells resistant to 4xAC and 4xAC + 4xPAC. The graph represents the migration ability of the cells. Subtracting the distance of the scratch on day 3 from the distance on day 1 showed a significant decrease in migration of both resistant MDA‐MB‐231 cells to 4xAC and 4xAC + 4xPAC. (b) Images represent mammosphere formation in control MDA‐MB‐231 cells, which formed clumped mammospheres, while MDA‐MB‐231 cells resistant to 4xAC formed more mammospheres (mean ± SD, 625 ± 25) relative to the cells resistant to 4xAC + 4xPAC (mean ± SD, 280 ± 21), scale bar = 2,000 μm. (c) Resistant or control MDA‐MB‐231 cells do not express E‐cadherin (positive E‐cadherin control blot can be found in Figure S6); however, cells resistant to 4xAC + 4xPAC overexpressed vimentin and ZEB1 to a greater extent. The graph represents the quantification of protein bands from five independent western blot experiments showing a significant increase in vimentin and ZEB1 in MDA‐MB‐231 cells resistant to 4xAC + 4xPAC. The experimental data are from five independent experiments (n = 5). *P < .05 significantly different from control cells; ANOVA and Tukey's post hoc test
