
Figure 5.
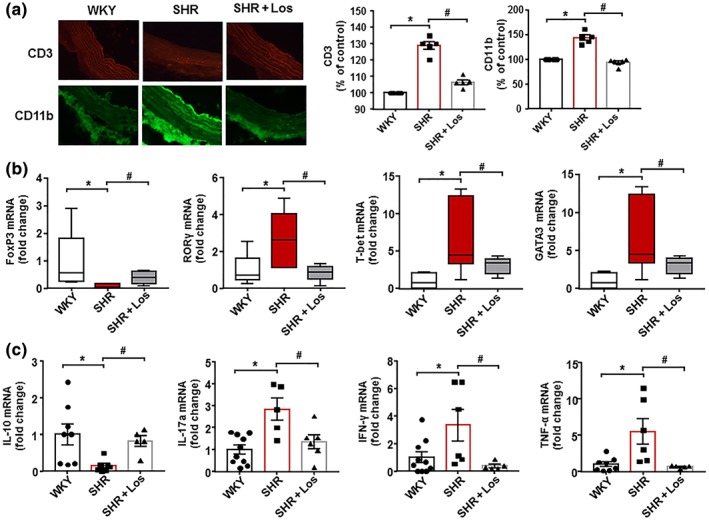
Losartan (Los) induces improvement of macrophage and T cell infiltration in vascular wall from spontaneously hypertensive rats (SHR). The upper pictures show aortic T cell infiltration measured by immunostaining of CD3 (red fluorescence). The lower pictures show aortic macrophage infiltration measured by immunostaining of CD11b (green fluorescence; 400× magnification). Data shown are individual values with means ± SEM of the red or green fluorescence (a). In (b),T cell infiltration in aortas from all experimental groups measured by mRNA levels of regulatory T cells (Treg; FoxP3), T helper (Th)17; RORγ), Th1 (T‐bet), and Th2 (GATA‐3) cells. Data are shown as box and whisker plots with medians, quartiles (box) and total range (whisker). In (c), mRNA levels of IL‐10, IL‐17a, IFN‐γ, and TNF‐α in aortas from Wistar Kyoto rats (WKY), SHR, and SHR treated with losartan (SHR‐Los). Values are expressed as mean ± SEM. * P < .05, significantly different from WKY. # P < .05, significantly different from untreated SHR