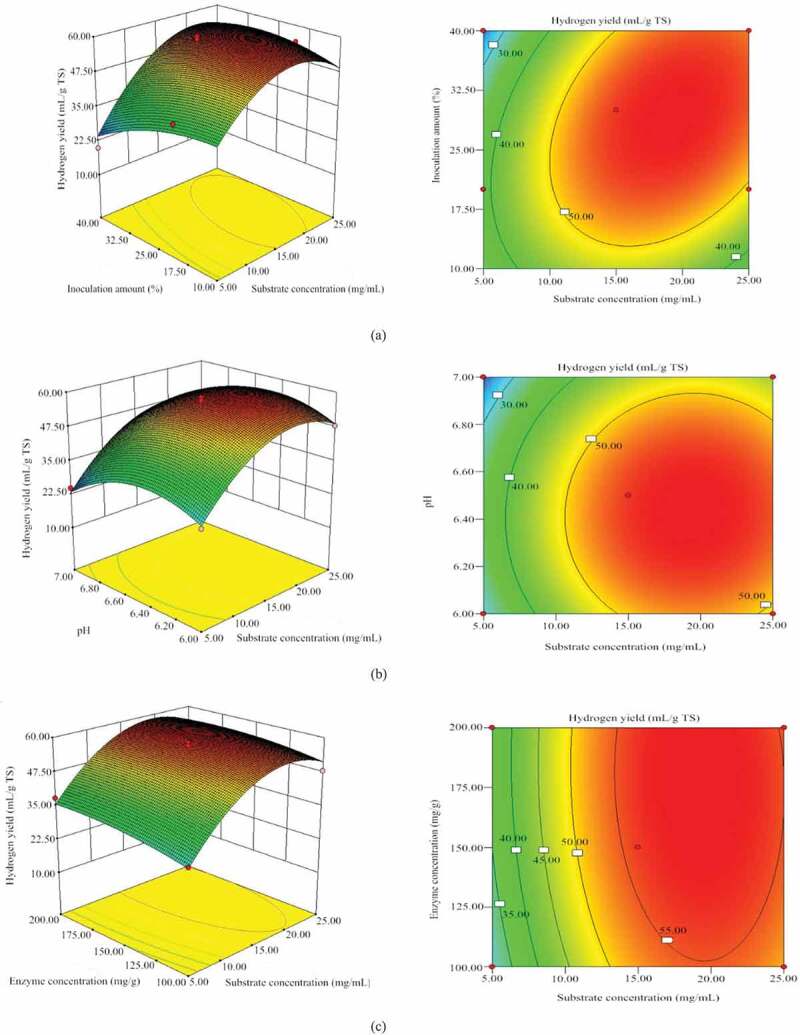
Figure 1.

Three-dimensional surface plot and Contour plot for hydrogen yield. The response surface model was obtained by the BBD with the date shown in Table 3. (a) the effect of substrate concentration, inoculation amount and their mutual interaction on hydrogen yield; (b) the effect of substrate concentration, initial pH and their mutual interaction on hydrogen yield; (c) the effect of substrate concentration, enzyme concentration and their mutual interaction on 1hydrogen yield. (d) the effect of inoculation amount, initial pH and their mutual interaction on hydrogen yield. (e) the effect of inoculation amount, enzyme concentration and their mutual interaction on hydrogen yield. (f) the effect of initial pH, enzyme concentration and their mutual interaction on hydrogen yield.
