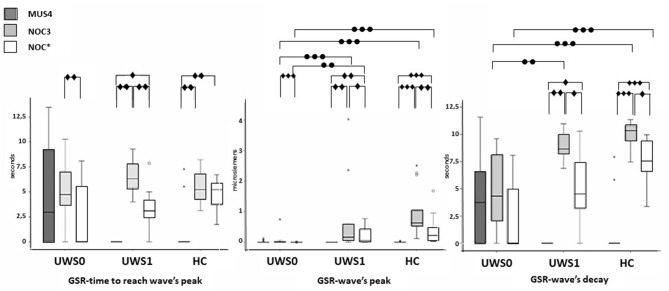
Figure 5.
Sequence A: boxplot of the GSR waves components. Time to reach the peak (left), wave's magnitude (center) and wave's decay (right) of each group were compared among them in MUS4, NOC3, and NOC* (diamond markers), and the groups (HC, UWS1, and UWS0) were compared among them for each session (point markers). The box represents the first and third quartile, the whiskers are the 1.5 interquartile range, the black lines are the medians, and points are outliers. Significant statistical difference: ∙p = [0.002–0.003]; ∙∙p = 0.001; ∙∙∙p < 0.0001; circle: Statistical difference between groups .

