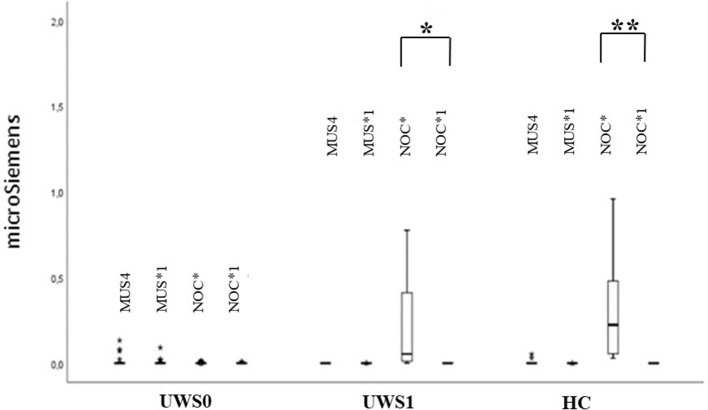
Figure 6.
Sequence B: boxplot of GSR magnitude. MUS4 vs. MUS1* and NOC* vs. NOC1* were compared. Only in the HC and UWS1 groups a significant difference between NOC* and NOC1* was observed (***HC: Z = −3.180, p < 0.0001, r = 0.88; **UWS1: Z = −2.666; p = 0.002; r = 0.60). The box represents the first and third quartile, the whiskers are the 1.5 interquartile range, the black lines are the medians, and points are outliers.

